29
/pt/
pt
AIzaSyAYiBZKx7MnpbEhh9jyipgxe19OcubqV5w
April 1, 2024
83068
Belize
BLZ
true
2
1
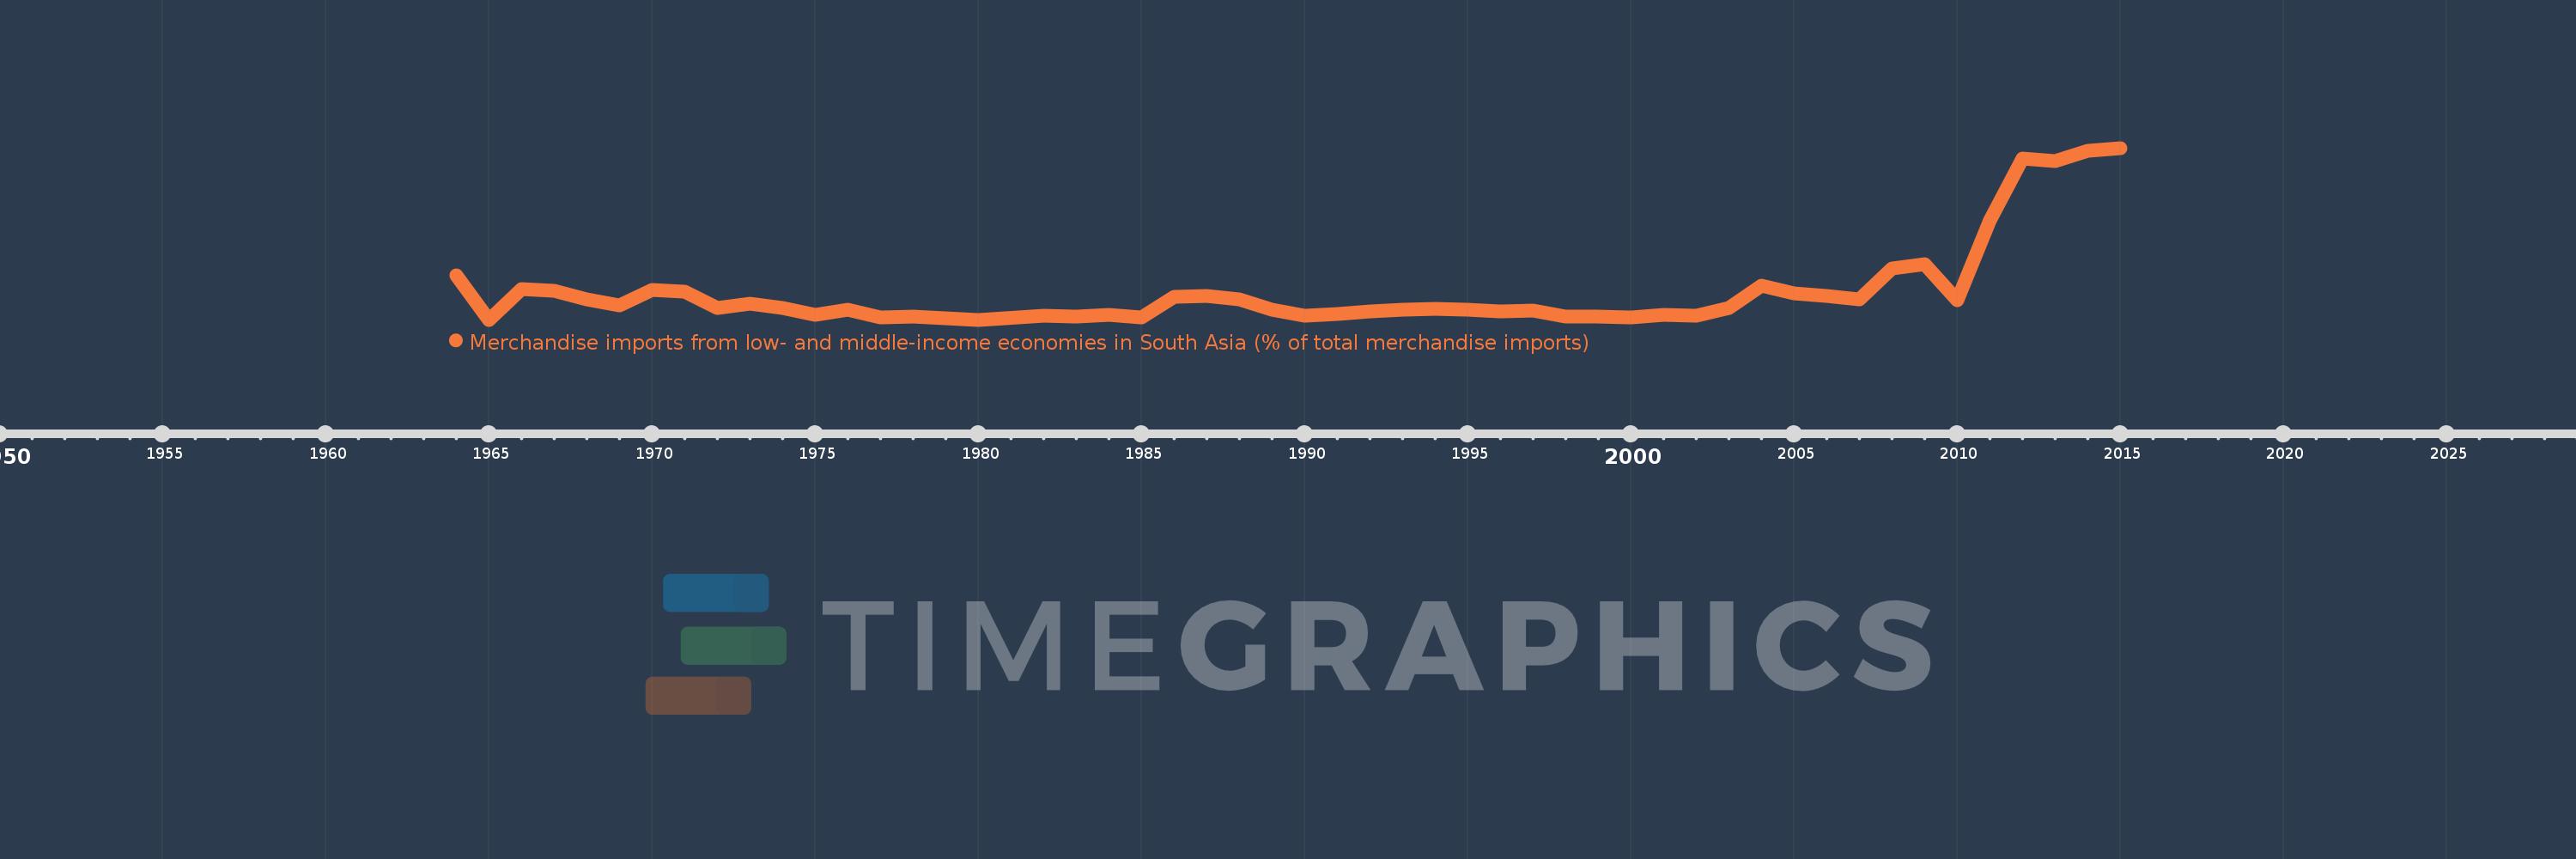
Merchandise imports from low- and middle-income economies in South Asia (% of total merchandise imports)
2015,2014,2013,2012,2011,2010,2009,2008,2007,2006,2005,2004,2003,2002,2001,2000,1999,1998,1997,1996,1995,1994,1993,1992,1991,1990,1989,1988,1987,1986,1985,1984,1983,1982,1980,1979,1978,1977,1976,1975,1974,1973,1972,1971,1970,1969,1968,1967,1966,1965,1964
Estas estatísticas em outros países:
AfghanistanAlbaniaAlgeriaAngolaAntigua and BarbudaArab WorldArgentinaArmeniaArubaAustraliaAustriaAzerbaijanBahamas, TheBahrainBangladeshBarbadosBelarusBelgiumBelizeBeninBermudaBoliviaBrazilBrunei DarussalamBulgariaBurkina FasoBurundiCabo VerdeCambodiaCameroonCanadaCaribbean small statesCentral African RepublicCentral Europe and the BalticsChadChileChinaColombiaCongo, Dem. Rep.Congo, Rep.Costa RicaCote d'IvoireCroatiaCubaCyprusCzech RepublicDenmarkDjiboutiDominicaDominican RepublicEarly-demographic dividendEast Asia & PacificEast Asia & Pacific (excluding high income)East Asia & Pacific (IDA & IBRD countries)EcuadorEgypt, Arab Rep.El SalvadorEstoniaEthiopiaEuro areaEurope & Central AsiaEurope & Central Asia (excluding high income)Europe & Central Asia (IDA & IBRD countries)European UnionFaroe IslandsFijiFinlandFragile and conflict affected situationsFranceGabonGambia, TheGeorgiaGermanyGhanaGibraltarGreeceGreenlandGrenadaGuatemalaGuineaGuyanaHaitiHeavily indebted poor countries (HIPC)High incomeHondurasHong Kong SAR, ChinaHungaryIBRD onlyIcelandIDA & IBRD totalIDA blendIDA onlyIDA totalIndiaIndonesiaIran, Islamic Rep.IraqIrelandIsraelItalyJamaicaJapanJordanKazakhstanKenyaKiribatiKorea, Dem. People’s Rep.Korea, Rep.KosovoKuwaitKyrgyz RepublicLao PDRLate-demographic dividendLatin America & Caribbean Latin America & Caribbean (excluding high income)Latin America & the Caribbean (IDA & IBRD countries)LatviaLeast developed countries: UN classificationLebanonLiberiaLibyaLithuaniaLow & middle incomeLow incomeLower middle incomeLuxembourgMacao SAR, ChinaMacedonia, FYRMadagascarMalawiMalaysiaMaldivesMaliMaltaMauritaniaMauritiusMexicoMiddle East & North AfricaMiddle East & North Africa (excluding high income)Middle East & North Africa (IDA & IBRD countries)Middle incomeMoldovaMongoliaMontenegroMoroccoMozambiqueMyanmarNauruNepalNetherlandsNew CaledoniaNew ZealandNicaraguaNigerNigeriaNorth AmericaNorwayOECD membersOmanOther small statesPacific island small statesPakistanPanamaPapua New GuineaParaguayPeruPhilippinesPolandPortugalPost-demographic dividendPre-demographic dividendQatarRomaniaRussian FederationRwandaSamoaSaudi ArabiaSenegalSerbiaSeychellesSierra LeoneSingaporeSlovak RepublicSloveniaSmall statesSolomon IslandsSomaliaSouth AfricaSouth AsiaSouth Asia (IDA & IBRD)SpainSri LankaSt. Kitts and NevisSt. LuciaSt. Vincent and the GrenadinesSub-Saharan Africa Sub-Saharan Africa (excluding high income)Sub-Saharan Africa (IDA & IBRD countries)SudanSurinameSwedenSwitzerlandSyrian Arab RepublicTajikistanTanzaniaThailandTogoTongaTrinidad and TobagoTunisiaTurkeyTurkmenistanUgandaUkraineUnited Arab EmiratesUnited KingdomUnited StatesUpper middle incomeUruguayUzbekistanVanuatuVenezuela, RBVietnamWorldYemen, Rep.ZambiaZimbabwe Linha do tempo:
Nesta escala de tempo está apresentado um gráfico de 1964 ano até 2015 ano Belize. Dados de 1963 ano ausente. O número de observações reais por data: 51.
Fonte (nome):
Indicadores de desenvolvimento mundial
Fonte (organização):
World Bank staff estimates based data from International Monetary Fund's Direction of Trade database.
Categorias:
Private Sector, Trade
Foi atualizado:
23 abr 2017 ano
Indicadores de alterações dos valores ao longo dos anos
Máximo:
2.383
1 jan 2015 ano
Na data de observação
Valor
Mudança absoluta
A alteração em relação ao valor anterior
1 jan 1964 ano
0.619
+0.619
0.0%
1 jan 1965 ano
0.0
-0.619
-100.0%
1 jan 1966 ano
0.426
+0.426
%
1 jan 1967 ano
0.398
-0.027
-6.44%
1 jan 1968 ano
0.282
-0.116
-29.23%
1 jan 1969 ano
0.2
-0.082
-29.14%
1 jan 1970 ano
0.409
+0.209
104.52%
1 jan 1971 ano
0.384
-0.025
-6.14%
1 jan 1972 ano
0.159
-0.225
-58.61%
1 jan 1973 ano
0.225
+0.066
41.75%
1 jan 1974 ano
0.164
-0.061
-27.03%
1 jan 1975 ano
0.073
-0.091
-55.68%
1 jan 1976 ano
0.137
+0.064
87.82%
1 jan 1977 ano
0.037
-0.1
-72.9%
1 jan 1978 ano
0.05
+0.013
33.88%
1 jan 1979 ano
0.018
-0.032
-64.36%
1 jan 1980 ano
0.0
-0.018
-100.0%
1 jan 1982 ano
0.052
+0.052
%
1 jan 1983 ano
0.048
-0.005
-9.2%
1 jan 1984 ano
0.067
+0.019
40.05%
1 jan 1985 ano
0.035
-0.031
-46.97%
1 jan 1986 ano
0.318
+0.283
799.83%
1 jan 1987 ano
0.332
+0.014
4.28%
1 jan 1988 ano
0.286
-0.046
-13.91%
1 jan 1989 ano
0.139
-0.147
-51.48%
1 jan 1990 ano
0.057
-0.082
-58.99%
1 jan 1991 ano
0.08
+0.023
39.82%
1 jan 1992 ano
0.112
+0.033
41.13%
1 jan 1993 ano
0.139
+0.027
23.86%
1 jan 1994 ano
0.149
+0.01
7.26%
1 jan 1995 ano
0.145
-0.004
-2.61%
1 jan 1996 ano
0.111
-0.034
-23.26%
1 jan 1997 ano
0.123
+0.011
10.14%
1 jan 1998 ano
0.046
-0.077
-62.83%
1 jan 1999 ano
0.049
+0.004
7.7%
1 jan 2000 ano
0.037
-0.012
-25.39%
1 jan 2001 ano
0.071
+0.034
92.87%
1 jan 2002 ano
0.052
-0.019
-26.3%
1 jan 2003 ano
0.16
+0.107
206.12%
1 jan 2004 ano
0.475
+0.316
197.89%
1 jan 2005 ano
0.364
-0.112
-23.49%
1 jan 2006 ano
0.327
-0.036
-10.0%
1 jan 2007 ano
0.282
-0.045
-13.8%
1 jan 2008 ano
0.71
+0.428
151.82%
1 jan 2009 ano
0.776
+0.065
9.17%
1 jan 2010 ano
0.276
-0.5
-64.41%
1 jan 2011 ano
1.381
+1.105
400.14%
1 jan 2012 ano
2.233
+0.852
61.72%
1 jan 2013 ano
2.203
-0.03
-1.33%
1 jan 2014 ano
2.348
+0.145
6.59%
1 jan 2015 ano
2.383
+0.035
1.49%
Classificação de países por estatísticas atuais por anos


Comentários: