29
/pt/
pt
AIzaSyAYiBZKx7MnpbEhh9jyipgxe19OcubqV5w
April 1, 2024
50225
Middle East & North Africa (IDA & IBRD countries)
TMN
false
2
1
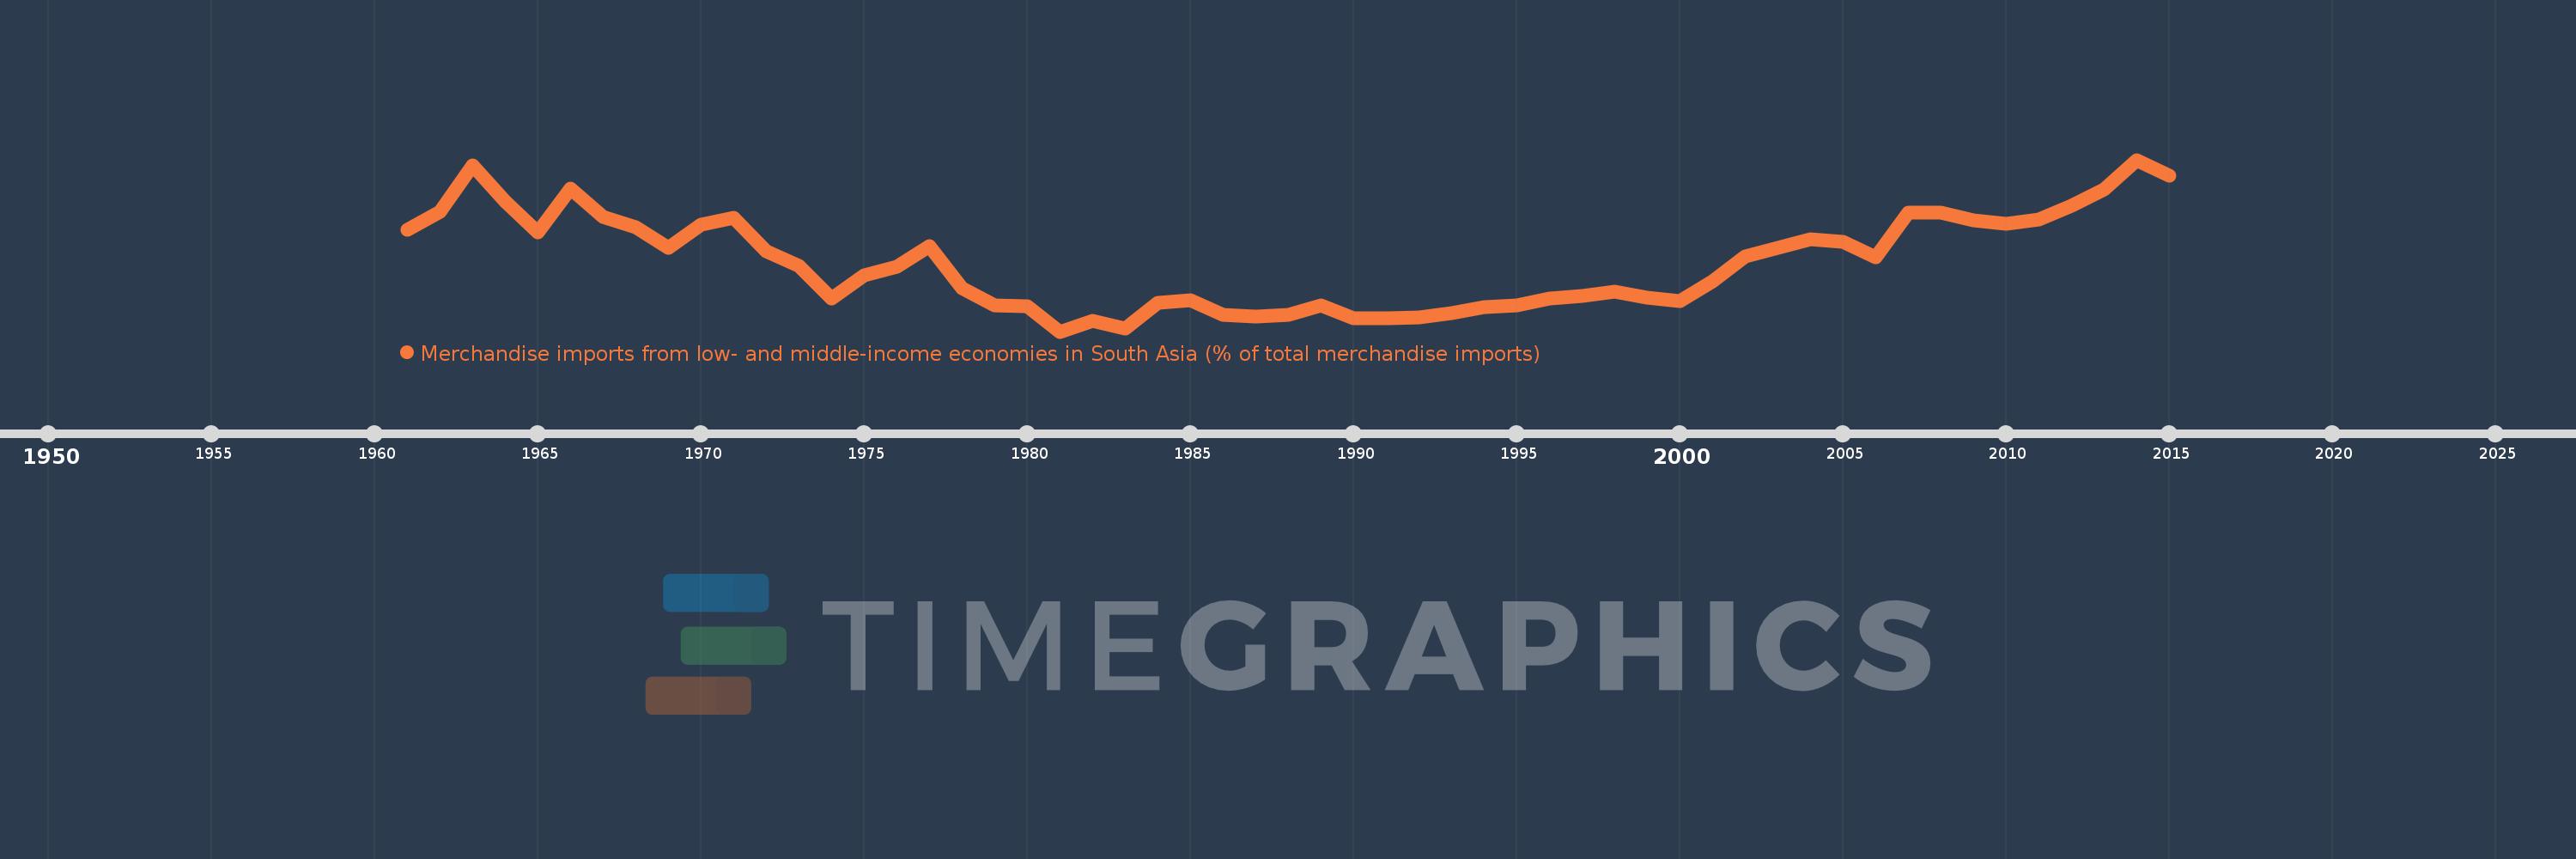
Merchandise imports from low- and middle-income economies in South Asia (% of total merchandise imports)
2015,2014,2013,2012,2011,2010,2009,2008,2007,2006,2005,2004,2003,2002,2001,2000,1999,1998,1997,1996,1995,1994,1993,1992,1991,1990,1989,1988,1987,1986,1985,1984,1983,1982,1981,1980,1979,1978,1977,1976,1975,1974,1973,1972,1971,1970,1969,1968,1967,1966,1965,1964,1963,1962,1961
Estas estatísticas em outros países:
AfghanistanAlbaniaAlgeriaAngolaAntigua and BarbudaArab WorldArgentinaArmeniaArubaAustraliaAustriaAzerbaijanBahamas, TheBahrainBangladeshBarbadosBelarusBelgiumBelizeBeninBermudaBoliviaBrazilBrunei DarussalamBulgariaBurkina FasoBurundiCabo VerdeCambodiaCameroonCanadaCaribbean small statesCentral African RepublicCentral Europe and the BalticsChadChileChinaColombiaCongo, Dem. Rep.Congo, Rep.Costa RicaCote d'IvoireCroatiaCubaCyprusCzech RepublicDenmarkDjiboutiDominicaDominican RepublicEarly-demographic dividendEast Asia & PacificEast Asia & Pacific (excluding high income)East Asia & Pacific (IDA & IBRD countries)EcuadorEgypt, Arab Rep.El SalvadorEstoniaEthiopiaEuro areaEurope & Central AsiaEurope & Central Asia (excluding high income)Europe & Central Asia (IDA & IBRD countries)European UnionFaroe IslandsFijiFinlandFragile and conflict affected situationsFranceGabonGambia, TheGeorgiaGermanyGhanaGibraltarGreeceGreenlandGrenadaGuatemalaGuineaGuyanaHaitiHeavily indebted poor countries (HIPC)High incomeHondurasHong Kong SAR, ChinaHungaryIBRD onlyIcelandIDA & IBRD totalIDA blendIDA onlyIDA totalIndiaIndonesiaIran, Islamic Rep.IraqIrelandIsraelItalyJamaicaJapanJordanKazakhstanKenyaKiribatiKorea, Dem. People’s Rep.Korea, Rep.KosovoKuwaitKyrgyz RepublicLao PDRLate-demographic dividendLatin America & Caribbean Latin America & Caribbean (excluding high income)Latin America & the Caribbean (IDA & IBRD countries)LatviaLeast developed countries: UN classificationLebanonLiberiaLibyaLithuaniaLow & middle incomeLow incomeLower middle incomeLuxembourgMacao SAR, ChinaMacedonia, FYRMadagascarMalawiMalaysiaMaldivesMaliMaltaMauritaniaMauritiusMexicoMiddle East & North AfricaMiddle East & North Africa (excluding high income)Middle East & North Africa (IDA & IBRD countries)Middle incomeMoldovaMongoliaMontenegroMoroccoMozambiqueMyanmarNauruNepalNetherlandsNew CaledoniaNew ZealandNicaraguaNigerNigeriaNorth AmericaNorwayOECD membersOmanOther small statesPacific island small statesPakistanPanamaPapua New GuineaParaguayPeruPhilippinesPolandPortugalPost-demographic dividendPre-demographic dividendQatarRomaniaRussian FederationRwandaSamoaSaudi ArabiaSenegalSerbiaSeychellesSierra LeoneSingaporeSlovak RepublicSloveniaSmall statesSolomon IslandsSomaliaSouth AfricaSouth AsiaSouth Asia (IDA & IBRD)SpainSri LankaSt. Kitts and NevisSt. LuciaSt. Vincent and the GrenadinesSub-Saharan Africa Sub-Saharan Africa (excluding high income)Sub-Saharan Africa (IDA & IBRD countries)SudanSurinameSwedenSwitzerlandSyrian Arab RepublicTajikistanTanzaniaThailandTogoTongaTrinidad and TobagoTunisiaTurkeyTurkmenistanUgandaUkraineUnited Arab EmiratesUnited KingdomUnited StatesUpper middle incomeUruguayUzbekistanVanuatuVenezuela, RBVietnamWorldYemen, Rep.ZambiaZimbabwe Linha do tempo:
Nesta escala de tempo está apresentado um gráfico de 1961 ano até 2015 ano Middle East & North Africa (IDA & IBRD countries). Dados de 1960 ano ausente. O número de observações reais por data: 55.
Fonte (nome):
Indicadores de desenvolvimento mundial
Fonte (organização):
World Bank staff estimates based data from International Monetary Fund's Direction of Trade database.
Categorias:
Private Sector, Trade
Foi atualizado:
23 abr 2017 ano
Indicadores de alterações dos valores ao longo dos anos
Mínimo:
0.785
1 jan 1981 ano
Máximo:
3.824
1 jan 2014 ano
Na data de observação
Valor
Mudança absoluta
A alteração em relação ao valor anterior
1 jan 1961 ano
2.583
+2.583
0.0%
1 jan 1962 ano
2.91
+0.327
12.67%
1 jan 1963 ano
3.722
+0.811
27.88%
1 jan 1964 ano
3.085
-0.636
-17.1%
1 jan 1965 ano
2.546
-0.539
-17.47%
1 jan 1966 ano
3.311
+0.764
30.02%
1 jan 1967 ano
2.815
-0.496
-14.97%
1 jan 1968 ano
2.637
-0.178
-6.31%
1 jan 1969 ano
2.271
-0.366
-13.88%
1 jan 1970 ano
2.678
+0.407
17.93%
1 jan 1971 ano
2.8
+0.122
4.55%
1 jan 1972 ano
2.209
-0.591
-21.11%
1 jan 1973 ano
1.951
-0.258
-11.7%
1 jan 1974 ano
1.375
-0.575
-29.5%
1 jan 1975 ano
1.784
+0.408
29.7%
1 jan 1976 ano
1.928
+0.144
8.1%
1 jan 1977 ano
2.296
+0.368
19.11%
1 jan 1978 ano
1.554
-0.742
-32.32%
1 jan 1979 ano
1.251
-0.303
-19.48%
1 jan 1980 ano
1.235
-0.016
-1.32%
1 jan 1981 ano
0.785
-0.45
-36.42%
1 jan 1982 ano
0.977
+0.191
24.35%
1 jan 1983 ano
0.839
-0.138
-14.1%
1 jan 1984 ano
1.298
+0.459
54.72%
1 jan 1985 ano
1.338
+0.04
3.08%
1 jan 1986 ano
1.085
-0.253
-18.9%
1 jan 1987 ano
1.048
-0.037
-3.38%
1 jan 1988 ano
1.08
+0.031
2.99%
1 jan 1989 ano
1.256
+0.176
16.31%
1 jan 1990 ano
1.028
-0.228
-18.15%
1 jan 1991 ano
1.017
-0.011
-1.06%
1 jan 1992 ano
1.039
+0.022
2.2%
1 jan 1993 ano
1.114
+0.074
7.16%
1 jan 1994 ano
1.221
+0.107
9.62%
1 jan 1995 ano
1.245
+0.024
1.96%
1 jan 1996 ano
1.373
+0.129
10.34%
1 jan 1997 ano
1.408
+0.034
2.49%
1 jan 1998 ano
1.488
+0.081
5.74%
1 jan 1999 ano
1.39
-0.098
-6.58%
1 jan 2000 ano
1.317
-0.074
-5.29%
1 jan 2001 ano
1.673
+0.356
27.01%
1 jan 2002 ano
2.12
+0.447
26.72%
1 jan 2003 ano
2.262
+0.142
6.72%
1 jan 2004 ano
2.423
+0.161
7.13%
1 jan 2005 ano
2.378
-0.045
-1.86%
1 jan 2006 ano
2.103
-0.276
-11.59%
1 jan 2007 ano
2.896
+0.793
37.73%
1 jan 2008 ano
2.884
-0.012
-0.41%
1 jan 2009 ano
2.758
-0.126
-4.37%
1 jan 2010 ano
2.696
-0.063
-2.27%
1 jan 2011 ano
2.772
+0.076
2.83%
1 jan 2012 ano
3.009
+0.238
8.57%
1 jan 2013 ano
3.305
+0.296
9.84%
1 jan 2014 ano
3.824
+0.518
15.68%
1 jan 2015 ano
3.548
-0.275
-7.2%
Classificação de países por estatísticas atuais por anos


Comentários: