29
/pt/
pt
AIzaSyAYiBZKx7MnpbEhh9jyipgxe19OcubqV5w
April 1, 2024
176680
Lebanon
LBN
true
2
1
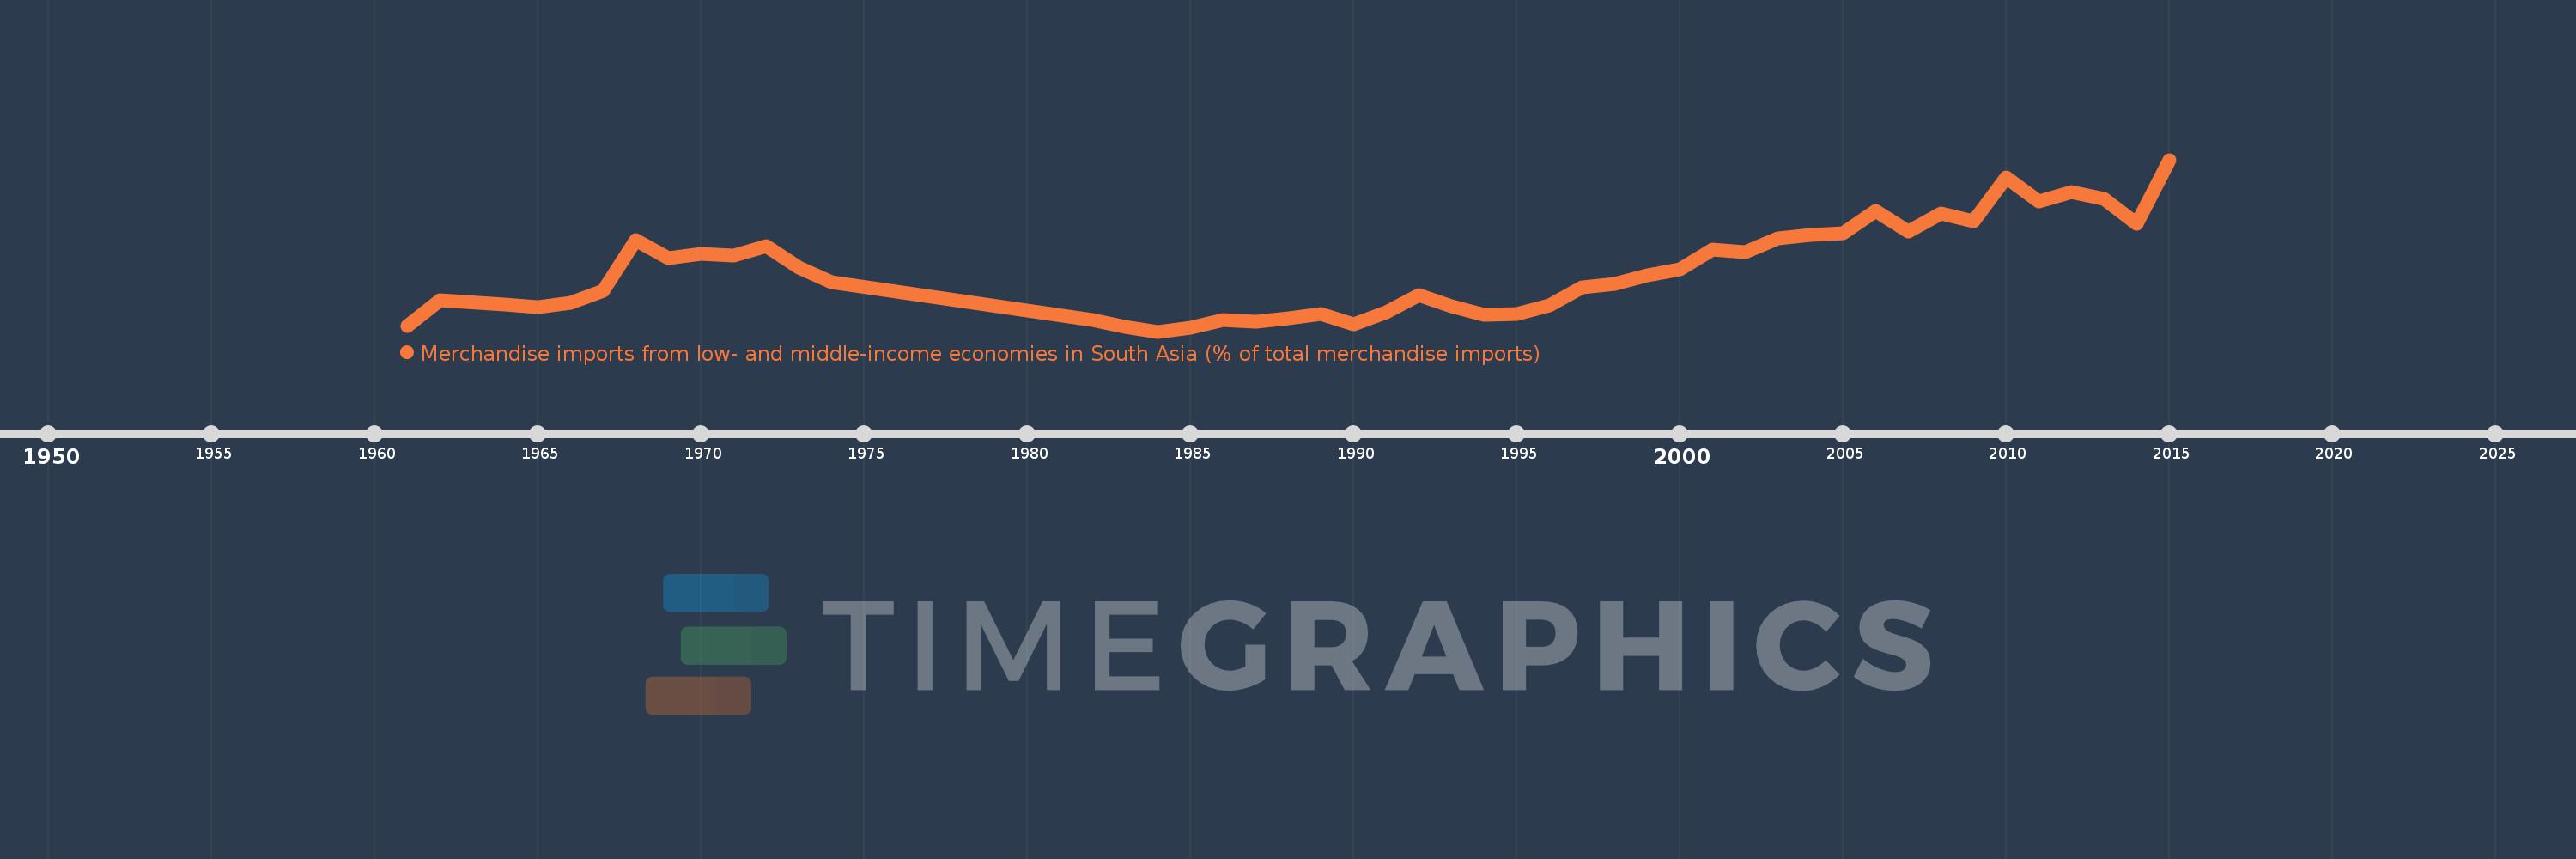
Merchandise imports from low- and middle-income economies in South Asia (% of total merchandise imports)
2015,2014,2013,2012,2011,2010,2009,2008,2007,2006,2005,2004,2003,2002,2001,2000,1999,1998,1997,1996,1995,1994,1993,1992,1991,1990,1989,1988,1987,1986,1985,1984,1983,1982,1974,1973,1972,1971,1970,1969,1968,1967,1966,1965,1964,1962,1961
Estas estatísticas em outros países:
AfghanistanAlbaniaAlgeriaAngolaAntigua and BarbudaArab WorldArgentinaArmeniaArubaAustraliaAustriaAzerbaijanBahamas, TheBahrainBangladeshBarbadosBelarusBelgiumBelizeBeninBermudaBoliviaBrazilBrunei DarussalamBulgariaBurkina FasoBurundiCabo VerdeCambodiaCameroonCanadaCaribbean small statesCentral African RepublicCentral Europe and the BalticsChadChileChinaColombiaCongo, Dem. Rep.Congo, Rep.Costa RicaCote d'IvoireCroatiaCubaCyprusCzech RepublicDenmarkDjiboutiDominicaDominican RepublicEarly-demographic dividendEast Asia & PacificEast Asia & Pacific (excluding high income)East Asia & Pacific (IDA & IBRD countries)EcuadorEgypt, Arab Rep.El SalvadorEstoniaEthiopiaEuro areaEurope & Central AsiaEurope & Central Asia (excluding high income)Europe & Central Asia (IDA & IBRD countries)European UnionFaroe IslandsFijiFinlandFragile and conflict affected situationsFranceGabonGambia, TheGeorgiaGermanyGhanaGibraltarGreeceGreenlandGrenadaGuatemalaGuineaGuyanaHaitiHeavily indebted poor countries (HIPC)High incomeHondurasHong Kong SAR, ChinaHungaryIBRD onlyIcelandIDA & IBRD totalIDA blendIDA onlyIDA totalIndiaIndonesiaIran, Islamic Rep.IraqIrelandIsraelItalyJamaicaJapanJordanKazakhstanKenyaKiribatiKorea, Dem. People’s Rep.Korea, Rep.KosovoKuwaitKyrgyz RepublicLao PDRLate-demographic dividendLatin America & Caribbean Latin America & Caribbean (excluding high income)Latin America & the Caribbean (IDA & IBRD countries)LatviaLeast developed countries: UN classificationLebanonLiberiaLibyaLithuaniaLow & middle incomeLow incomeLower middle incomeLuxembourgMacao SAR, ChinaMacedonia, FYRMadagascarMalawiMalaysiaMaldivesMaliMaltaMauritaniaMauritiusMexicoMiddle East & North AfricaMiddle East & North Africa (excluding high income)Middle East & North Africa (IDA & IBRD countries)Middle incomeMoldovaMongoliaMontenegroMoroccoMozambiqueMyanmarNauruNepalNetherlandsNew CaledoniaNew ZealandNicaraguaNigerNigeriaNorth AmericaNorwayOECD membersOmanOther small statesPacific island small statesPakistanPanamaPapua New GuineaParaguayPeruPhilippinesPolandPortugalPost-demographic dividendPre-demographic dividendQatarRomaniaRussian FederationRwandaSamoaSaudi ArabiaSenegalSerbiaSeychellesSierra LeoneSingaporeSlovak RepublicSloveniaSmall statesSolomon IslandsSomaliaSouth AfricaSouth AsiaSouth Asia (IDA & IBRD)SpainSri LankaSt. Kitts and NevisSt. LuciaSt. Vincent and the GrenadinesSub-Saharan Africa Sub-Saharan Africa (excluding high income)Sub-Saharan Africa (IDA & IBRD countries)SudanSurinameSwedenSwitzerlandSyrian Arab RepublicTajikistanTanzaniaThailandTogoTongaTrinidad and TobagoTunisiaTurkeyTurkmenistanUgandaUkraineUnited Arab EmiratesUnited KingdomUnited StatesUpper middle incomeUruguayUzbekistanVanuatuVenezuela, RBVietnamWorldYemen, Rep.ZambiaZimbabwe Linha do tempo:
Nesta escala de tempo está apresentado um gráfico de 1961 ano até 2015 ano Lebanon. Dados de 1960 ano ausente. O número de observações reais por data: 47.
Fonte (nome):
Indicadores de desenvolvimento mundial
Fonte (organização):
World Bank staff estimates based data from International Monetary Fund's Direction of Trade database.
Categorias:
Private Sector, Trade
Foi atualizado:
23 abr 2017 ano
Indicadores de alterações dos valores ao longo dos anos
Mínimo:
0.185
1 jan 1984 ano
Máximo:
2.495
1 jan 2015 ano
Na data de observação
Valor
Mudança absoluta
A alteração em relação ao valor anterior
1 jan 1961 ano
0.257
+0.257
0.0%
1 jan 1962 ano
0.602
+0.345
134.05%
1 jan 1964 ano
0.544
-0.058
-9.66%
1 jan 1965 ano
0.511
-0.033
-6.11%
1 jan 1966 ano
0.572
+0.061
11.94%
1 jan 1967 ano
0.732
+0.161
28.09%
1 jan 1968 ano
1.414
+0.681
93.04%
1 jan 1969 ano
1.172
-0.242
-17.1%
1 jan 1970 ano
1.233
+0.061
5.23%
1 jan 1971 ano
1.21
-0.023
-1.87%
1 jan 1972 ano
1.338
+0.128
10.56%
1 jan 1973 ano
1.042
-0.296
-22.1%
1 jan 1974 ano
0.851
-0.191
-18.34%
1 jan 1982 ano
0.342
-0.509
-59.85%
1 jan 1983 ano
0.243
-0.099
-28.92%
1 jan 1984 ano
0.185
-0.058
-23.85%
1 jan 1985 ano
0.238
+0.053
28.91%
1 jan 1986 ano
0.344
+0.106
44.42%
1 jan 1987 ano
0.313
-0.032
-9.17%
1 jan 1988 ano
0.363
+0.05
16.05%
1 jan 1989 ano
0.423
+0.06
16.64%
1 jan 1990 ano
0.283
-0.14
-33.07%
1 jan 1991 ano
0.444
+0.161
56.87%
1 jan 1992 ano
0.681
+0.236
53.18%
1 jan 1993 ano
0.524
-0.156
-22.99%
1 jan 1994 ano
0.411
-0.113
-21.53%
1 jan 1995 ano
0.426
+0.015
3.53%
1 jan 1996 ano
0.535
+0.109
25.69%
1 jan 1997 ano
0.785
+0.25
46.68%
1 jan 1998 ano
0.831
+0.046
5.84%
1 jan 1999 ano
0.939
+0.108
13.02%
1 jan 2000 ano
1.021
+0.082
8.71%
1 jan 2001 ano
1.284
+0.263
25.77%
1 jan 2002 ano
1.256
-0.029
-2.25%
1 jan 2003 ano
1.437
+0.182
14.47%
1 jan 2004 ano
1.485
+0.047
3.3%
1 jan 2005 ano
1.503
+0.019
1.25%
1 jan 2006 ano
1.81
+0.306
20.38%
1 jan 2007 ano
1.534
-0.276
-15.23%
1 jan 2008 ano
1.775
+0.241
15.72%
1 jan 2009 ano
1.673
-0.103
-5.78%
1 jan 2010 ano
2.261
+0.588
35.15%
1 jan 2011 ano
1.934
-0.327
-14.45%
1 jan 2012 ano
2.059
+0.125
6.48%
1 jan 2013 ano
1.972
-0.087
-4.24%
1 jan 2014 ano
1.639
-0.333
-16.91%
1 jan 2015 ano
2.495
+0.856
52.27%
Classificação de países por estatísticas atuais por anos


Comentários: