29
/pt/
pt
AIzaSyAYiBZKx7MnpbEhh9jyipgxe19OcubqV5w
April 1, 2024
113875
Cote d'Ivoire
CIV
true
2
1
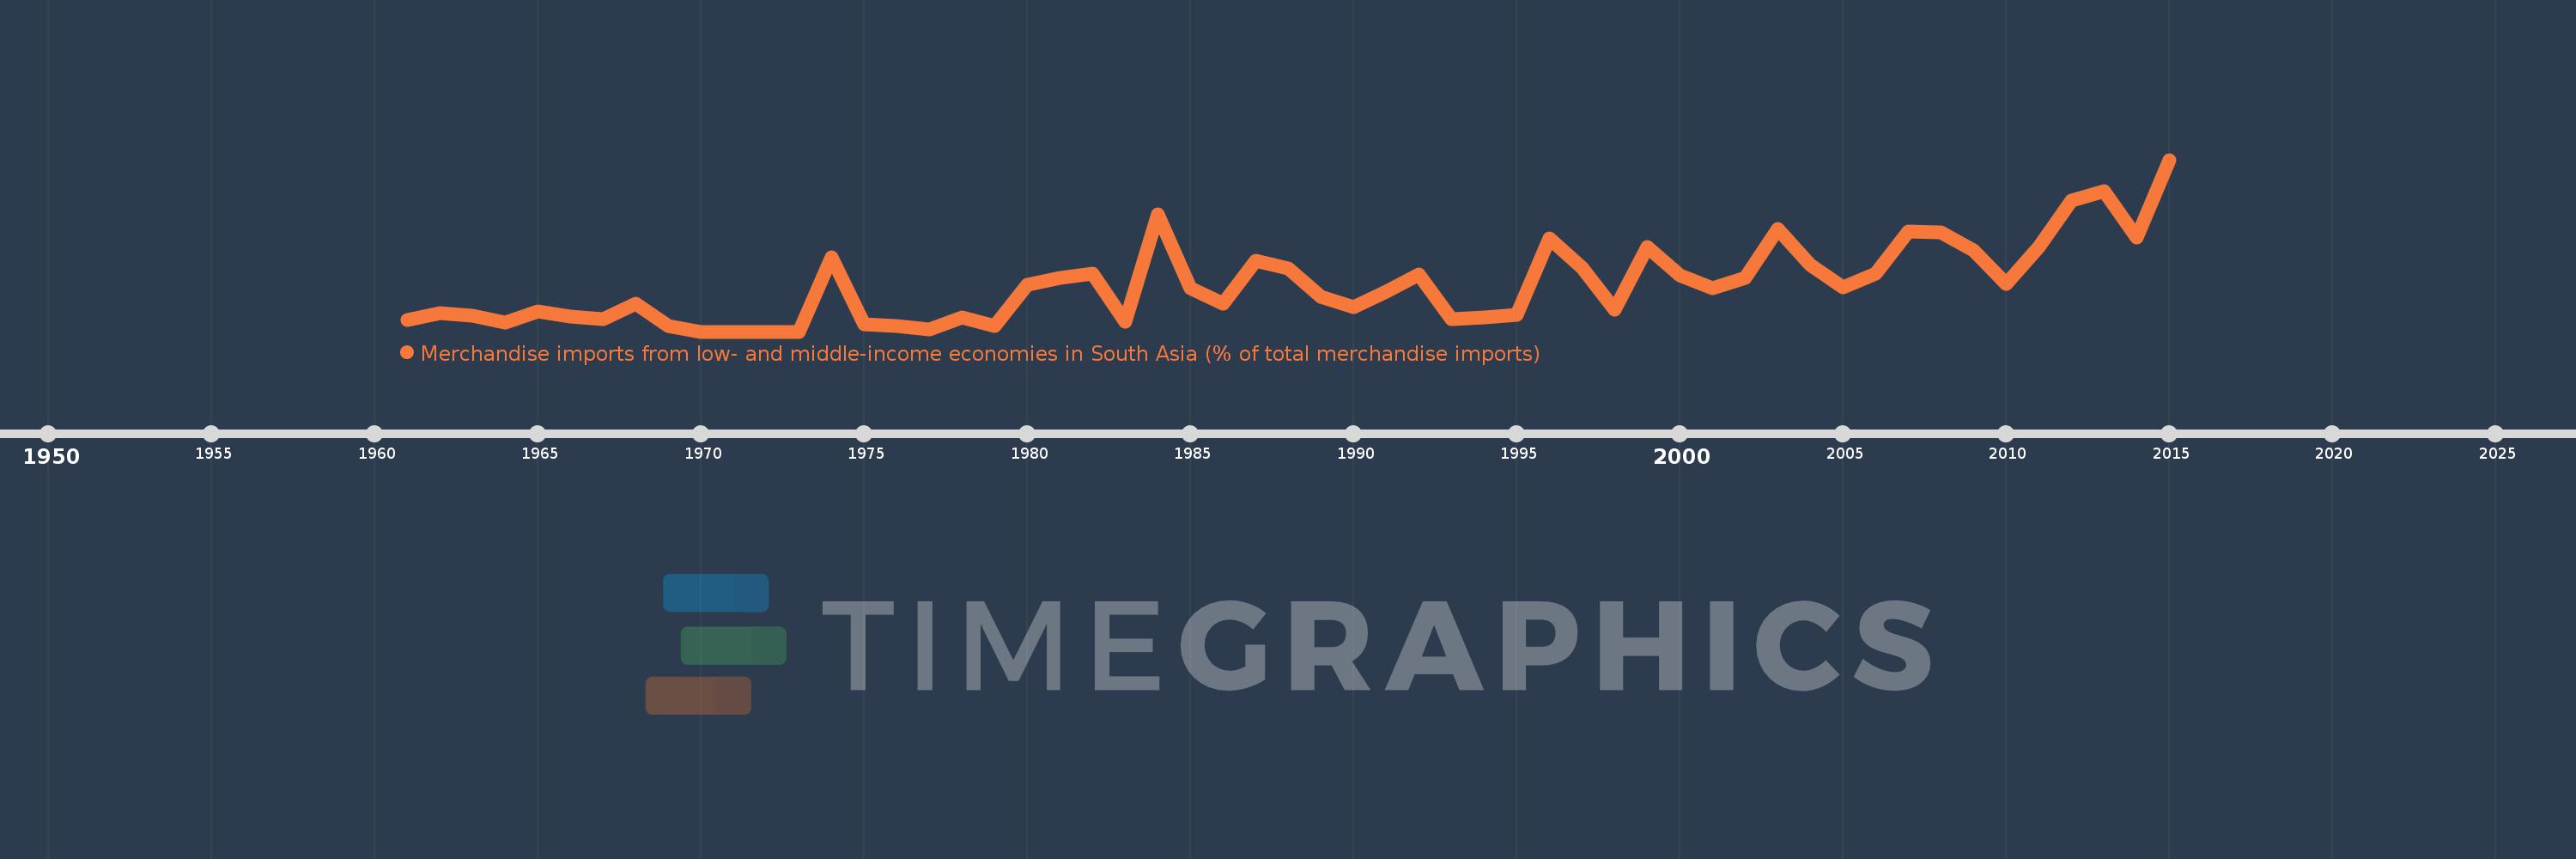
Merchandise imports from low- and middle-income economies in South Asia (% of total merchandise imports)
2015,2014,2013,2012,2011,2010,2009,2008,2007,2006,2005,2004,2003,2002,2001,2000,1999,1998,1997,1996,1995,1994,1993,1992,1991,1990,1989,1988,1987,1986,1985,1984,1983,1982,1981,1980,1979,1978,1977,1976,1975,1974,1973,1972,1971,1970,1969,1968,1967,1966,1965,1964,1963,1962,1961
Estas estatísticas em outros países:
AfghanistanAlbaniaAlgeriaAngolaAntigua and BarbudaArab WorldArgentinaArmeniaArubaAustraliaAustriaAzerbaijanBahamas, TheBahrainBangladeshBarbadosBelarusBelgiumBelizeBeninBermudaBoliviaBrazilBrunei DarussalamBulgariaBurkina FasoBurundiCabo VerdeCambodiaCameroonCanadaCaribbean small statesCentral African RepublicCentral Europe and the BalticsChadChileChinaColombiaCongo, Dem. Rep.Congo, Rep.Costa RicaCote d'IvoireCroatiaCubaCyprusCzech RepublicDenmarkDjiboutiDominicaDominican RepublicEarly-demographic dividendEast Asia & PacificEast Asia & Pacific (excluding high income)East Asia & Pacific (IDA & IBRD countries)EcuadorEgypt, Arab Rep.El SalvadorEstoniaEthiopiaEuro areaEurope & Central AsiaEurope & Central Asia (excluding high income)Europe & Central Asia (IDA & IBRD countries)European UnionFaroe IslandsFijiFinlandFragile and conflict affected situationsFranceGabonGambia, TheGeorgiaGermanyGhanaGibraltarGreeceGreenlandGrenadaGuatemalaGuineaGuyanaHaitiHeavily indebted poor countries (HIPC)High incomeHondurasHong Kong SAR, ChinaHungaryIBRD onlyIcelandIDA & IBRD totalIDA blendIDA onlyIDA totalIndiaIndonesiaIran, Islamic Rep.IraqIrelandIsraelItalyJamaicaJapanJordanKazakhstanKenyaKiribatiKorea, Dem. People’s Rep.Korea, Rep.KosovoKuwaitKyrgyz RepublicLao PDRLate-demographic dividendLatin America & Caribbean Latin America & Caribbean (excluding high income)Latin America & the Caribbean (IDA & IBRD countries)LatviaLeast developed countries: UN classificationLebanonLiberiaLibyaLithuaniaLow & middle incomeLow incomeLower middle incomeLuxembourgMacao SAR, ChinaMacedonia, FYRMadagascarMalawiMalaysiaMaldivesMaliMaltaMauritaniaMauritiusMexicoMiddle East & North AfricaMiddle East & North Africa (excluding high income)Middle East & North Africa (IDA & IBRD countries)Middle incomeMoldovaMongoliaMontenegroMoroccoMozambiqueMyanmarNauruNepalNetherlandsNew CaledoniaNew ZealandNicaraguaNigerNigeriaNorth AmericaNorwayOECD membersOmanOther small statesPacific island small statesPakistanPanamaPapua New GuineaParaguayPeruPhilippinesPolandPortugalPost-demographic dividendPre-demographic dividendQatarRomaniaRussian FederationRwandaSamoaSaudi ArabiaSenegalSerbiaSeychellesSierra LeoneSingaporeSlovak RepublicSloveniaSmall statesSolomon IslandsSomaliaSouth AfricaSouth AsiaSouth Asia (IDA & IBRD)SpainSri LankaSt. Kitts and NevisSt. LuciaSt. Vincent and the GrenadinesSub-Saharan Africa Sub-Saharan Africa (excluding high income)Sub-Saharan Africa (IDA & IBRD countries)SudanSurinameSwedenSwitzerlandSyrian Arab RepublicTajikistanTanzaniaThailandTogoTongaTrinidad and TobagoTunisiaTurkeyTurkmenistanUgandaUkraineUnited Arab EmiratesUnited KingdomUnited StatesUpper middle incomeUruguayUzbekistanVanuatuVenezuela, RBVietnamWorldYemen, Rep.ZambiaZimbabwe Linha do tempo:
Nesta escala de tempo está apresentado um gráfico de 1961 ano até 2015 ano Cote d'Ivoire. Dados de 1960 ano ausente. O número de observações reais por data: 55.
Fonte (nome):
Indicadores de desenvolvimento mundial
Fonte (organização):
World Bank staff estimates based data from International Monetary Fund's Direction of Trade database.
Categorias:
Private Sector, Trade
Foi atualizado:
23 abr 2017 ano
Indicadores de alterações dos valores ao longo dos anos
Máximo:
5.458
1 jan 2015 ano
Na data de observação
Valor
Mudança absoluta
A alteração em relação ao valor anterior
1 jan 1961 ano
0.359
+0.359
0.0%
1 jan 1962 ano
0.579
+0.221
61.52%
1 jan 1963 ano
0.512
-0.067
-11.57%
1 jan 1964 ano
0.294
-0.218
-42.54%
1 jan 1965 ano
0.654
+0.36
122.36%
1 jan 1966 ano
0.466
-0.188
-28.74%
1 jan 1967 ano
0.388
-0.078
-16.75%
1 jan 1968 ano
0.891
+0.502
129.4%
1 jan 1969 ano
0.191
-0.699
-78.51%
1 jan 1970 ano
0.0
-0.191
-100.0%
1 jan 1974 ano
2.353
+2.353
%
1 jan 1975 ano
0.242
-2.111
-89.7%
1 jan 1976 ano
0.175
-0.067
-27.76%
1 jan 1977 ano
0.059
-0.116
-66.52%
1 jan 1978 ano
0.463
+0.404
689.88%
1 jan 1979 ano
0.179
-0.284
-61.33%
1 jan 1980 ano
1.49
+1.311
732.54%
1 jan 1981 ano
1.719
+0.229
15.36%
1 jan 1982 ano
1.846
+0.127
7.37%
1 jan 1983 ano
0.315
-1.531
-82.94%
1 jan 1984 ano
3.736
+3.421
1.09 mil%
1 jan 1985 ano
1.382
-2.354
-63.02%
1 jan 1986 ano
0.879
-0.503
-36.37%
1 jan 1987 ano
2.263
+1.384
157.46%
1 jan 1988 ano
2.009
-0.254
-11.22%
1 jan 1989 ano
1.094
-0.916
-45.57%
1 jan 1990 ano
0.769
-0.325
-29.73%
1 jan 1991 ano
1.271
+0.503
65.4%
1 jan 1992 ano
1.818
+0.547
43.03%
1 jan 1993 ano
0.398
-1.42
-78.12%
1 jan 1994 ano
0.439
+0.042
10.45%
1 jan 1995 ano
0.525
+0.086
19.59%
1 jan 1996 ano
2.968
+2.442
464.8%
1 jan 1997 ano
2.027
-0.941
-31.72%
1 jan 1998 ano
0.693
-1.334
-65.82%
1 jan 1999 ano
2.681
+1.989
287.08%
1 jan 2000 ano
1.776
-0.905
-33.76%
1 jan 2001 ano
1.385
-0.391
-22.03%
1 jan 2002 ano
1.706
+0.321
23.15%
1 jan 2003 ano
3.255
+1.55
90.87%
1 jan 2004 ano
2.118
-1.137
-34.93%
1 jan 2005 ano
1.401
-0.717
-33.85%
1 jan 2006 ano
1.844
+0.442
31.56%
1 jan 2007 ano
3.185
+1.342
72.79%
1 jan 2008 ano
3.146
-0.04
-1.25%
1 jan 2009 ano
2.58
-0.566
-17.99%
1 jan 2010 ano
1.513
-1.067
-41.35%
1 jan 2011 ano
2.687
+1.174
77.62%
1 jan 2012 ano
4.155
+1.467
54.59%
1 jan 2013 ano
4.457
+0.303
7.29%
1 jan 2014 ano
2.996
-1.461
-32.78%
1 jan 2015 ano
5.458
+2.461
82.15%
Classificação de países por estatísticas atuais por anos


Comentários: