29
/pt/
pt
AIzaSyAYiBZKx7MnpbEhh9jyipgxe19OcubqV5w
April 1, 2024
164022
Japan
JPN
true
2
1
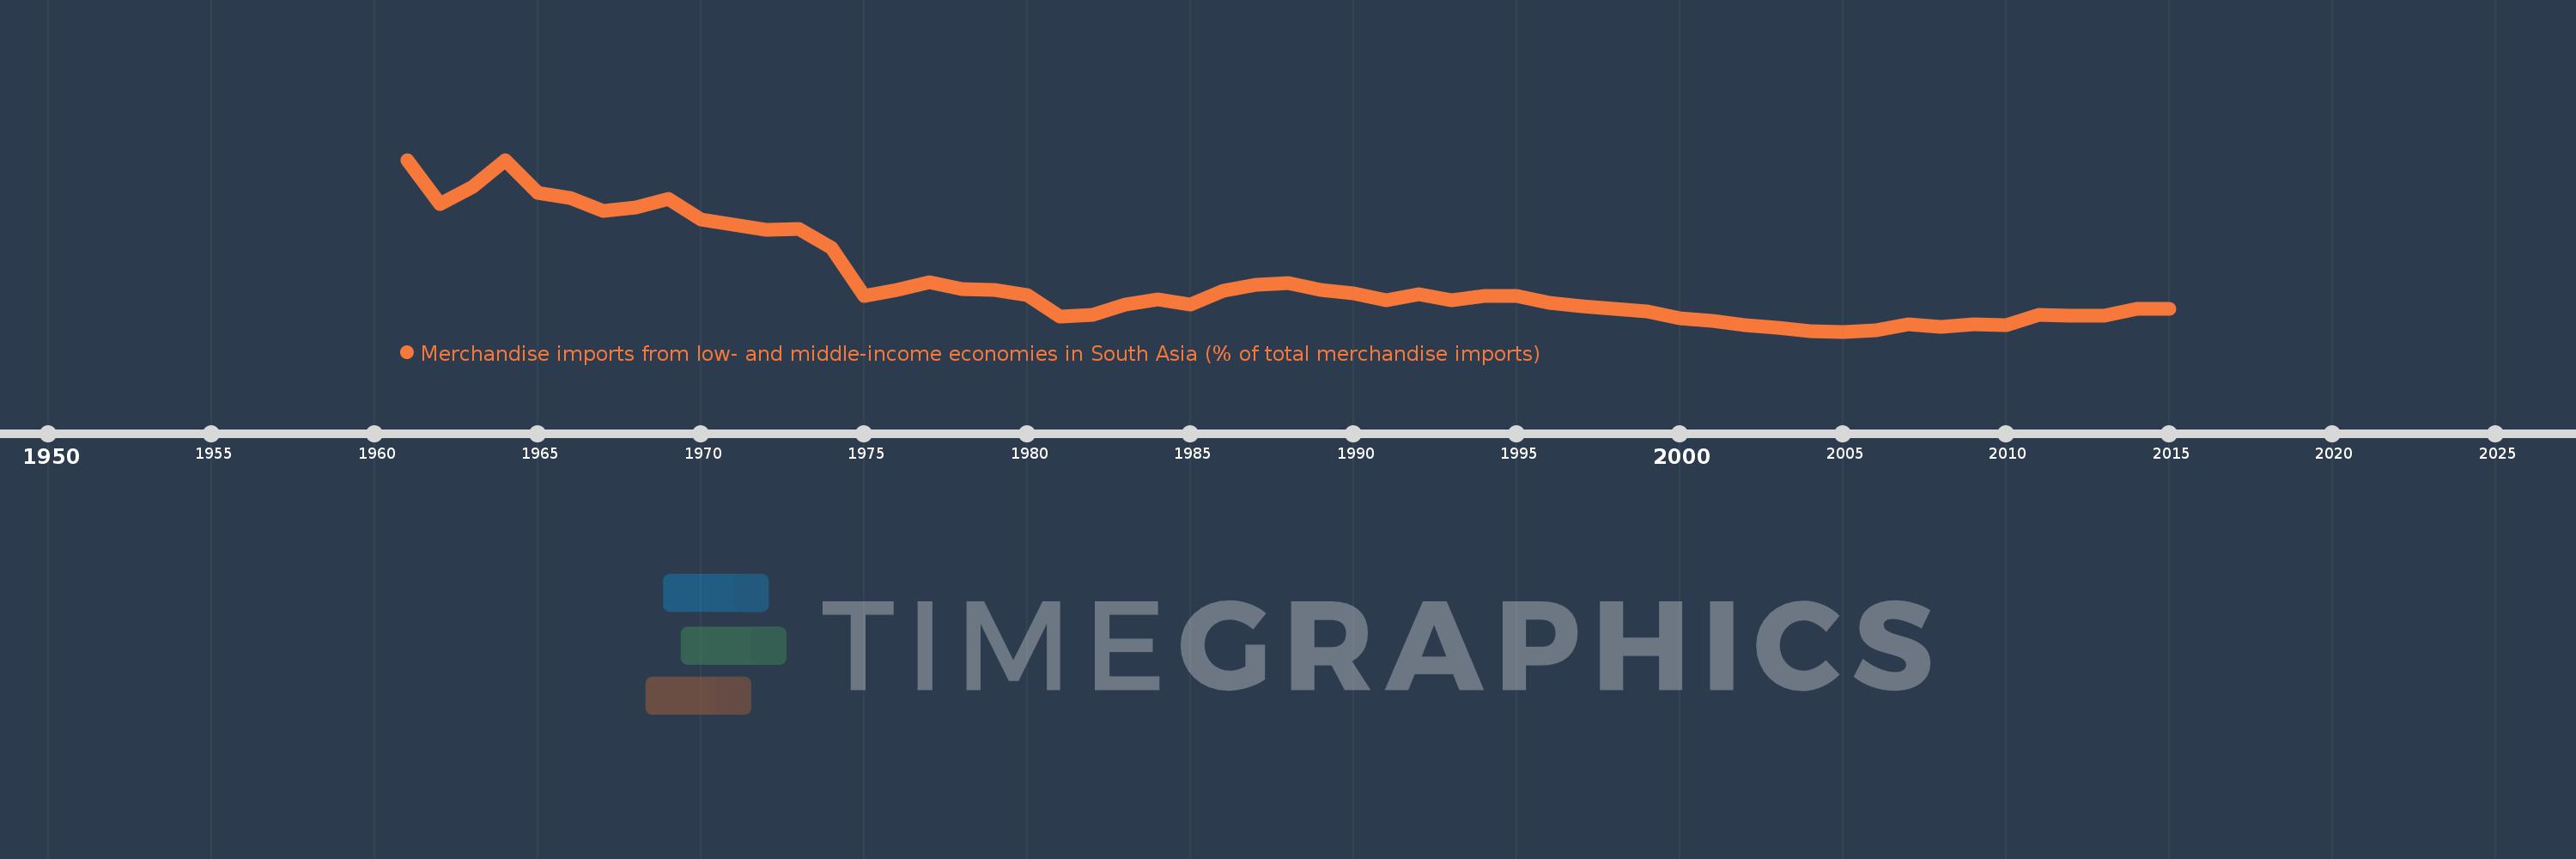
Merchandise imports from low- and middle-income economies in South Asia (% of total merchandise imports)
2015,2014,2013,2012,2011,2010,2009,2008,2007,2006,2005,2004,2003,2002,2001,2000,1999,1998,1997,1996,1995,1994,1993,1992,1991,1990,1989,1988,1987,1986,1985,1984,1983,1982,1981,1980,1979,1978,1977,1976,1975,1974,1973,1972,1971,1970,1969,1968,1967,1966,1965,1964,1963,1962,1961
Estas estatísticas em outros países:
AfghanistanAlbaniaAlgeriaAngolaAntigua and BarbudaArab WorldArgentinaArmeniaArubaAustraliaAustriaAzerbaijanBahamas, TheBahrainBangladeshBarbadosBelarusBelgiumBelizeBeninBermudaBoliviaBrazilBrunei DarussalamBulgariaBurkina FasoBurundiCabo VerdeCambodiaCameroonCanadaCaribbean small statesCentral African RepublicCentral Europe and the BalticsChadChileChinaColombiaCongo, Dem. Rep.Congo, Rep.Costa RicaCote d'IvoireCroatiaCubaCyprusCzech RepublicDenmarkDjiboutiDominicaDominican RepublicEarly-demographic dividendEast Asia & PacificEast Asia & Pacific (excluding high income)East Asia & Pacific (IDA & IBRD countries)EcuadorEgypt, Arab Rep.El SalvadorEstoniaEthiopiaEuro areaEurope & Central AsiaEurope & Central Asia (excluding high income)Europe & Central Asia (IDA & IBRD countries)European UnionFaroe IslandsFijiFinlandFragile and conflict affected situationsFranceGabonGambia, TheGeorgiaGermanyGhanaGibraltarGreeceGreenlandGrenadaGuatemalaGuineaGuyanaHaitiHeavily indebted poor countries (HIPC)High incomeHondurasHong Kong SAR, ChinaHungaryIBRD onlyIcelandIDA & IBRD totalIDA blendIDA onlyIDA totalIndiaIndonesiaIran, Islamic Rep.IraqIrelandIsraelItalyJamaicaJapanJordanKazakhstanKenyaKiribatiKorea, Dem. People’s Rep.Korea, Rep.KosovoKuwaitKyrgyz RepublicLao PDRLate-demographic dividendLatin America & Caribbean Latin America & Caribbean (excluding high income)Latin America & the Caribbean (IDA & IBRD countries)LatviaLeast developed countries: UN classificationLebanonLiberiaLibyaLithuaniaLow & middle incomeLow incomeLower middle incomeLuxembourgMacao SAR, ChinaMacedonia, FYRMadagascarMalawiMalaysiaMaldivesMaliMaltaMauritaniaMauritiusMexicoMiddle East & North AfricaMiddle East & North Africa (excluding high income)Middle East & North Africa (IDA & IBRD countries)Middle incomeMoldovaMongoliaMontenegroMoroccoMozambiqueMyanmarNauruNepalNetherlandsNew CaledoniaNew ZealandNicaraguaNigerNigeriaNorth AmericaNorwayOECD membersOmanOther small statesPacific island small statesPakistanPanamaPapua New GuineaParaguayPeruPhilippinesPolandPortugalPost-demographic dividendPre-demographic dividendQatarRomaniaRussian FederationRwandaSamoaSaudi ArabiaSenegalSerbiaSeychellesSierra LeoneSingaporeSlovak RepublicSloveniaSmall statesSolomon IslandsSomaliaSouth AfricaSouth AsiaSouth Asia (IDA & IBRD)SpainSri LankaSt. Kitts and NevisSt. LuciaSt. Vincent and the GrenadinesSub-Saharan Africa Sub-Saharan Africa (excluding high income)Sub-Saharan Africa (IDA & IBRD countries)SudanSurinameSwedenSwitzerlandSyrian Arab RepublicTajikistanTanzaniaThailandTogoTongaTrinidad and TobagoTunisiaTurkeyTurkmenistanUgandaUkraineUnited Arab EmiratesUnited KingdomUnited StatesUpper middle incomeUruguayUzbekistanVanuatuVenezuela, RBVietnamWorldYemen, Rep.ZambiaZimbabwe Linha do tempo:
Nesta escala de tempo está apresentado um gráfico de 1961 ano até 2015 ano Japan. Dados de 1960 ano ausente. O número de observações reais por data: 55.
Fonte (nome):
Indicadores de desenvolvimento mundial
Fonte (organização):
World Bank staff estimates based data from International Monetary Fund's Direction of Trade database.
Categorias:
Private Sector, Trade
Foi atualizado:
23 abr 2017 ano
Indicadores de alterações dos valores ao longo dos anos
Mínimo:
0.693
1 jan 2005 ano
Máximo:
3.449
1 jan 1961 ano
Na data de observação
Valor
Mudança absoluta
A alteração em relação ao valor anterior
1 jan 1961 ano
3.449
+3.449
0.0%
1 jan 1962 ano
2.737
-0.713
-20.66%
1 jan 1963 ano
3.013
+0.276
10.1%
1 jan 1964 ano
3.441
+0.428
14.21%
1 jan 1965 ano
2.924
-0.517
-15.02%
1 jan 1966 ano
2.834
-0.09
-3.09%
1 jan 1967 ano
2.631
-0.203
-7.16%
1 jan 1968 ano
2.68
+0.049
1.87%
1 jan 1969 ano
2.822
+0.141
5.28%
1 jan 1970 ano
2.498
-0.323
-11.46%
1 jan 1971 ano
2.402
-0.096
-3.84%
1 jan 1972 ano
2.323
-0.079
-3.28%
1 jan 1973 ano
2.341
+0.018
0.77%
1 jan 1974 ano
2.037
-0.304
-13.0%
1 jan 1975 ano
1.262
-0.775
-38.04%
1 jan 1976 ano
1.363
+0.101
8.01%
1 jan 1977 ano
1.487
+0.124
9.09%
1 jan 1978 ano
1.378
-0.109
-7.33%
1 jan 1979 ano
1.36
-0.018
-1.34%
1 jan 1980 ano
1.273
-0.087
-6.38%
1 jan 1981 ano
0.94
-0.333
-26.12%
1 jan 1982 ano
0.966
+0.025
2.7%
1 jan 1983 ano
1.131
+0.165
17.09%
1 jan 1984 ano
1.21
+0.079
6.99%
1 jan 1985 ano
1.126
-0.084
-6.96%
1 jan 1986 ano
1.343
+0.218
19.34%
1 jan 1987 ano
1.443
+0.099
7.4%
1 jan 1988 ano
1.468
+0.026
1.78%
1 jan 1989 ano
1.367
-0.101
-6.87%
1 jan 1990 ano
1.306
-0.061
-4.48%
1 jan 1991 ano
1.201
-0.105
-8.03%
1 jan 1992 ano
1.286
+0.085
7.07%
1 jan 1993 ano
1.195
-0.092
-7.12%
1 jan 1994 ano
1.258
+0.063
5.29%
1 jan 1995 ano
1.27
+0.012
0.97%
1 jan 1996 ano
1.161
-0.109
-8.59%
1 jan 1997 ano
1.104
-0.057
-4.91%
1 jan 1998 ano
1.055
-0.049
-4.4%
1 jan 1999 ano
1.012
-0.044
-4.13%
1 jan 2000 ano
0.907
-0.104
-10.31%
1 jan 2001 ano
0.859
-0.048
-5.33%
1 jan 2002 ano
0.793
-0.066
-7.68%
1 jan 2003 ano
0.754
-0.039
-4.87%
1 jan 2004 ano
0.694
-0.061
-8.05%
1 jan 2005 ano
0.693
-0.001
-0.12%
1 jan 2006 ano
0.718
+0.025
3.65%
1 jan 2007 ano
0.815
+0.097
13.48%
1 jan 2008 ano
0.773
-0.042
-5.19%
1 jan 2009 ano
0.804
+0.031
4.01%
1 jan 2010 ano
0.802
-0.002
-0.2%
1 jan 2011 ano
0.958
+0.156
19.42%
1 jan 2012 ano
0.949
-0.009
-0.91%
1 jan 2013 ano
0.953
+0.003
0.37%
1 jan 2014 ano
1.053
+0.1
10.54%
1 jan 2015 ano
1.055
+0.002
0.21%
Classificação de países por estatísticas atuais por anos


Comentários: