29
/pt/
pt
AIzaSyAYiBZKx7MnpbEhh9jyipgxe19OcubqV5w
April 1, 2024
219847
Papua New Guinea
PNG
true
2
1
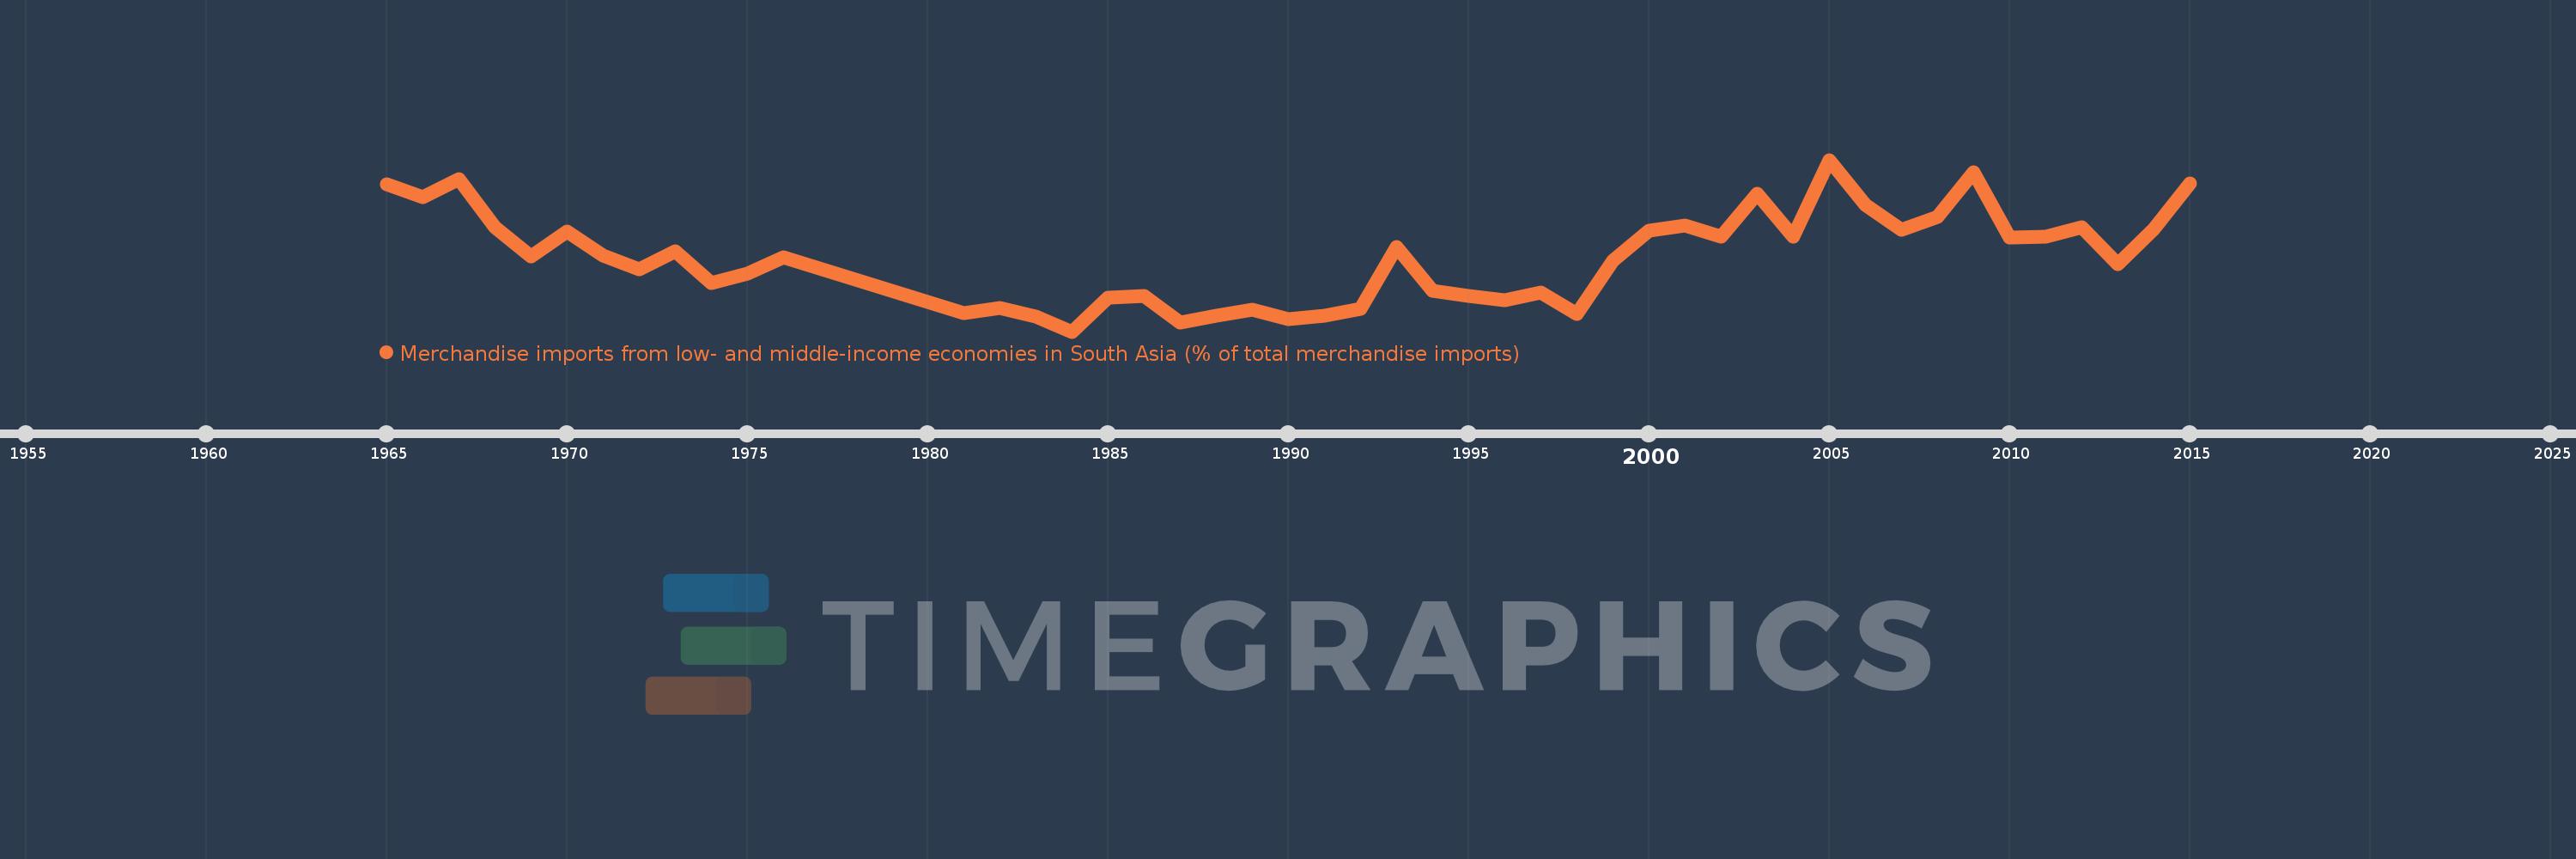
Merchandise imports from low- and middle-income economies in South Asia (% of total merchandise imports)
2015,2014,2013,2012,2011,2010,2009,2008,2007,2006,2005,2004,2003,2002,2001,2000,1999,1998,1997,1996,1995,1994,1993,1992,1991,1990,1989,1988,1987,1986,1985,1984,1983,1982,1981,1976,1975,1974,1973,1972,1971,1970,1969,1968,1967,1966,1965
Estas estatísticas em outros países:
AfghanistanAlbaniaAlgeriaAngolaAntigua and BarbudaArab WorldArgentinaArmeniaArubaAustraliaAustriaAzerbaijanBahamas, TheBahrainBangladeshBarbadosBelarusBelgiumBelizeBeninBermudaBoliviaBrazilBrunei DarussalamBulgariaBurkina FasoBurundiCabo VerdeCambodiaCameroonCanadaCaribbean small statesCentral African RepublicCentral Europe and the BalticsChadChileChinaColombiaCongo, Dem. Rep.Congo, Rep.Costa RicaCote d'IvoireCroatiaCubaCyprusCzech RepublicDenmarkDjiboutiDominicaDominican RepublicEarly-demographic dividendEast Asia & PacificEast Asia & Pacific (excluding high income)East Asia & Pacific (IDA & IBRD countries)EcuadorEgypt, Arab Rep.El SalvadorEstoniaEthiopiaEuro areaEurope & Central AsiaEurope & Central Asia (excluding high income)Europe & Central Asia (IDA & IBRD countries)European UnionFaroe IslandsFijiFinlandFragile and conflict affected situationsFranceGabonGambia, TheGeorgiaGermanyGhanaGibraltarGreeceGreenlandGrenadaGuatemalaGuineaGuyanaHaitiHeavily indebted poor countries (HIPC)High incomeHondurasHong Kong SAR, ChinaHungaryIBRD onlyIcelandIDA & IBRD totalIDA blendIDA onlyIDA totalIndiaIndonesiaIran, Islamic Rep.IraqIrelandIsraelItalyJamaicaJapanJordanKazakhstanKenyaKiribatiKorea, Dem. People’s Rep.Korea, Rep.KosovoKuwaitKyrgyz RepublicLao PDRLate-demographic dividendLatin America & Caribbean Latin America & Caribbean (excluding high income)Latin America & the Caribbean (IDA & IBRD countries)LatviaLeast developed countries: UN classificationLebanonLiberiaLibyaLithuaniaLow & middle incomeLow incomeLower middle incomeLuxembourgMacao SAR, ChinaMacedonia, FYRMadagascarMalawiMalaysiaMaldivesMaliMaltaMauritaniaMauritiusMexicoMiddle East & North AfricaMiddle East & North Africa (excluding high income)Middle East & North Africa (IDA & IBRD countries)Middle incomeMoldovaMongoliaMontenegroMoroccoMozambiqueMyanmarNauruNepalNetherlandsNew CaledoniaNew ZealandNicaraguaNigerNigeriaNorth AmericaNorwayOECD membersOmanOther small statesPacific island small statesPakistanPanamaPapua New GuineaParaguayPeruPhilippinesPolandPortugalPost-demographic dividendPre-demographic dividendQatarRomaniaRussian FederationRwandaSamoaSaudi ArabiaSenegalSerbiaSeychellesSierra LeoneSingaporeSlovak RepublicSloveniaSmall statesSolomon IslandsSomaliaSouth AfricaSouth AsiaSouth Asia (IDA & IBRD)SpainSri LankaSt. Kitts and NevisSt. LuciaSt. Vincent and the GrenadinesSub-Saharan Africa Sub-Saharan Africa (excluding high income)Sub-Saharan Africa (IDA & IBRD countries)SudanSurinameSwedenSwitzerlandSyrian Arab RepublicTajikistanTanzaniaThailandTogoTongaTrinidad and TobagoTunisiaTurkeyTurkmenistanUgandaUkraineUnited Arab EmiratesUnited KingdomUnited StatesUpper middle incomeUruguayUzbekistanVanuatuVenezuela, RBVietnamWorldYemen, Rep.ZambiaZimbabwe Linha do tempo:
Nesta escala de tempo está apresentado um gráfico de 1965 ano até 2015 ano Papua New Guinea. Dados de 1964 ano ausente. O número de observações reais por data: 47.
Fonte (nome):
Indicadores de desenvolvimento mundial
Fonte (organização):
World Bank staff estimates based data from International Monetary Fund's Direction of Trade database.
Categorias:
Private Sector, Trade
Foi atualizado:
23 abr 2017 ano
Indicadores de alterações dos valores ao longo dos anos
Mínimo:
0.119
1 jan 1984 ano
Máximo:
0.871
1 jan 2005 ano
Na data de observação
Valor
Mudança absoluta
A alteração em relação ao valor anterior
1 jan 1965 ano
0.765
+0.765
0.0%
1 jan 1966 ano
0.708
-0.058
-7.52%
1 jan 1967 ano
0.787
+0.079
11.16%
1 jan 1968 ano
0.574
-0.213
-27.09%
1 jan 1969 ano
0.447
-0.127
-22.13%
1 jan 1970 ano
0.556
+0.109
24.45%
1 jan 1971 ano
0.452
-0.104
-18.76%
1 jan 1972 ano
0.392
-0.06
-13.29%
1 jan 1973 ano
0.47
+0.079
20.08%
1 jan 1974 ano
0.333
-0.137
-29.16%
1 jan 1975 ano
0.374
+0.041
12.26%
1 jan 1976 ano
0.444
+0.07
18.74%
1 jan 1981 ano
0.199
-0.245
-55.11%
1 jan 1982 ano
0.224
+0.024
12.22%
1 jan 1983 ano
0.183
-0.041
-18.35%
1 jan 1984 ano
0.119
-0.063
-34.62%
1 jan 1985 ano
0.268
+0.149
124.55%
1 jan 1986 ano
0.274
+0.006
2.21%
1 jan 1987 ano
0.159
-0.115
-41.89%
1 jan 1988 ano
0.19
+0.03
19.01%
1 jan 1989 ano
0.214
+0.024
12.71%
1 jan 1990 ano
0.174
-0.039
-18.49%
1 jan 1991 ano
0.188
+0.014
7.88%
1 jan 1992 ano
0.217
+0.029
15.7%
1 jan 1993 ano
0.489
+0.272
125.19%
1 jan 1994 ano
0.297
-0.193
-39.36%
1 jan 1995 ano
0.274
-0.023
-7.61%
1 jan 1996 ano
0.256
-0.018
-6.64%
1 jan 1997 ano
0.289
+0.033
12.94%
1 jan 1998 ano
0.197
-0.093
-32.02%
1 jan 1999 ano
0.43
+0.234
118.89%
1 jan 2000 ano
0.559
+0.129
29.93%
1 jan 2001 ano
0.584
+0.025
4.5%
1 jan 2002 ano
0.534
-0.05
-8.6%
1 jan 2003 ano
0.724
+0.19
35.58%
1 jan 2004 ano
0.533
-0.191
-26.42%
1 jan 2005 ano
0.871
+0.338
63.48%
1 jan 2006 ano
0.675
-0.196
-22.49%
1 jan 2007 ano
0.563
-0.112
-16.59%
1 jan 2008 ano
0.62
+0.057
10.13%
1 jan 2009 ano
0.818
+0.198
31.92%
1 jan 2010 ano
0.53
-0.288
-35.18%
1 jan 2011 ano
0.536
+0.006
1.2%
1 jan 2012 ano
0.574
+0.038
7.04%
1 jan 2013 ano
0.414
-0.161
-27.97%
1 jan 2014 ano
0.57
+0.156
37.71%
1 jan 2015 ano
0.767
+0.197
34.65%
Classificação de países por estatísticas atuais por anos


Comentários: