29
/pt/
pt
AIzaSyAYiBZKx7MnpbEhh9jyipgxe19OcubqV5w
April 1, 2024
73232
Australia
AUS
true
2
1
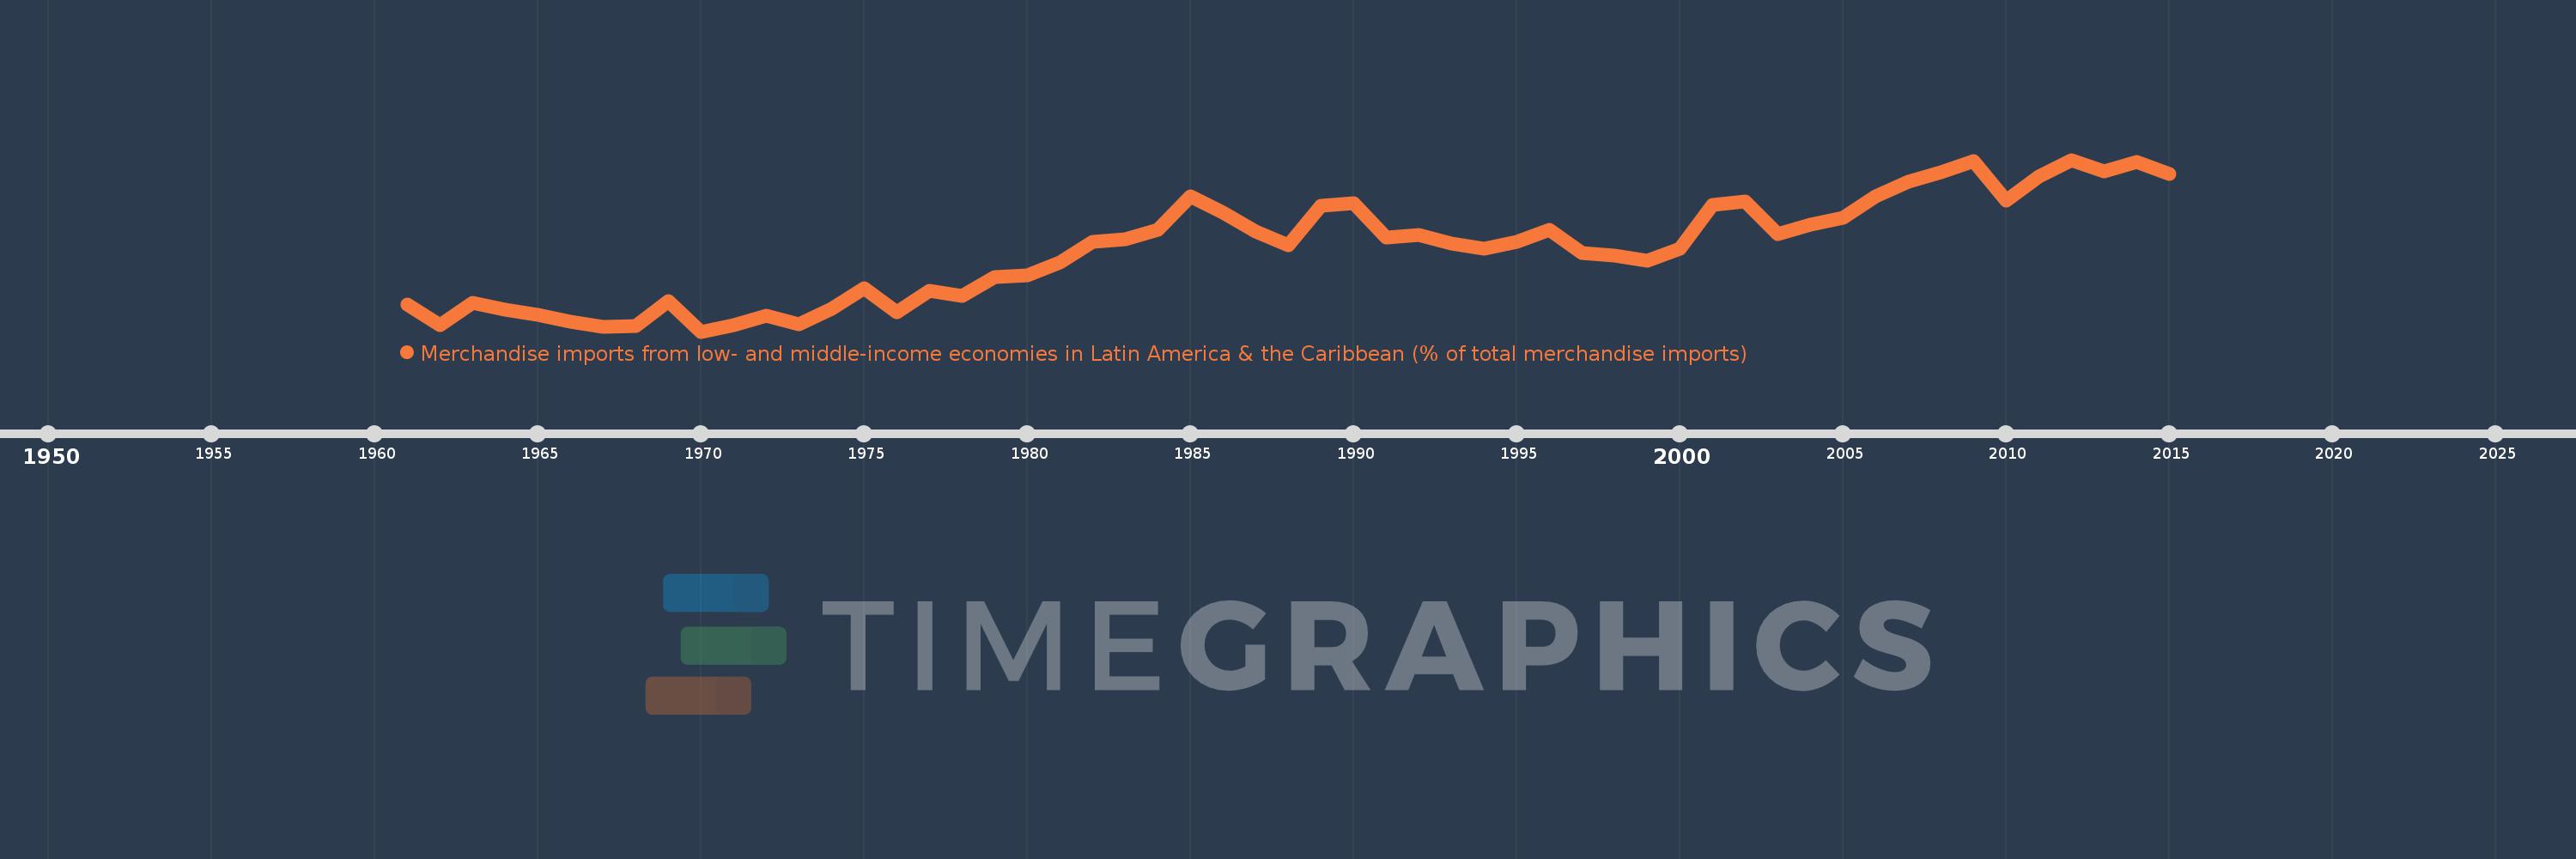
Merchandise imports from low- and middle-income economies in Latin America & the Caribbean (% of total merchandise imports)
2015,2014,2013,2012,2011,2010,2009,2008,2007,2006,2005,2004,2003,2002,2001,2000,1999,1998,1997,1996,1995,1994,1993,1992,1991,1990,1989,1988,1987,1986,1985,1984,1983,1982,1981,1980,1979,1978,1977,1976,1975,1974,1973,1972,1971,1970,1969,1968,1967,1966,1965,1964,1963,1962,1961
Estas estatísticas em outros países:
AfghanistanAlbaniaAlgeriaAngolaAntigua and BarbudaArab WorldArgentinaArmeniaArubaAustraliaAustriaAzerbaijanBahamas, TheBahrainBangladeshBarbadosBelarusBelgiumBelizeBeninBermudaBoliviaBrazilBrunei DarussalamBulgariaBurkina FasoCabo VerdeCambodiaCameroonCanadaCaribbean small statesCentral African RepublicCentral Europe and the BalticsChileChinaColombiaCongo, Dem. Rep.Congo, Rep.Costa RicaCote d'IvoireCroatiaCubaCyprusCzech RepublicDenmarkDominicaDominican RepublicEarly-demographic dividendEast Asia & PacificEast Asia & Pacific (excluding high income)East Asia & Pacific (IDA & IBRD countries)EcuadorEgypt, Arab Rep.El SalvadorEstoniaEthiopiaEuro areaEurope & Central AsiaEurope & Central Asia (excluding high income)Europe & Central Asia (IDA & IBRD countries)European UnionFaroe IslandsFijiFinlandFragile and conflict affected situationsFranceFrench PolynesiaGabonGambia, TheGeorgiaGermanyGhanaGibraltarGreeceGreenlandGrenadaGuatemalaGuineaGuyanaHaitiHeavily indebted poor countries (HIPC)High incomeHondurasHong Kong SAR, ChinaHungaryIBRD onlyIcelandIDA & IBRD totalIDA blendIDA onlyIDA totalIndiaIndonesiaIran, Islamic Rep.IraqIrelandIsraelItalyJamaicaJapanJordanKazakhstanKenyaKorea, Dem. People’s Rep.Korea, Rep.KuwaitKyrgyz RepublicLate-demographic dividendLatin America & Caribbean Latin America & Caribbean (excluding high income)Latin America & the Caribbean (IDA & IBRD countries)LatviaLeast developed countries: UN classificationLebanonLiberiaLibyaLithuaniaLow & middle incomeLow incomeLower middle incomeLuxembourgMacao SAR, ChinaMacedonia, FYRMadagascarMalawiMalaysiaMaldivesMaliMaltaMauritaniaMauritiusMexicoMiddle East & North AfricaMiddle East & North Africa (excluding high income)Middle East & North Africa (IDA & IBRD countries)Middle incomeMoldovaMongoliaMontenegroMoroccoMozambiqueNetherlandsNew CaledoniaNew ZealandNicaraguaNigerNigeriaNorth AmericaNorwayOECD membersOmanOther small statesPacific island small statesPakistanPanamaPapua New GuineaParaguayPeruPhilippinesPolandPortugalPost-demographic dividendPre-demographic dividendQatarRomaniaRussian FederationSaudi ArabiaSenegalSerbiaSierra LeoneSingaporeSlovak RepublicSloveniaSmall statesSomaliaSouth AfricaSouth AsiaSouth Asia (IDA & IBRD)SpainSri LankaSt. Kitts and NevisSt. LuciaSt. Vincent and the GrenadinesSub-Saharan Africa Sub-Saharan Africa (excluding high income)Sub-Saharan Africa (IDA & IBRD countries)SudanSurinameSwedenSwitzerlandSyrian Arab RepublicTanzaniaThailandTogoTrinidad and TobagoTunisiaTurkeyUgandaUkraineUnited Arab EmiratesUnited KingdomUnited StatesUpper middle incomeUruguayVenezuela, RBVietnamWorldYemen, Rep.ZambiaZimbabwe Linha do tempo:
Nesta escala de tempo está apresentado um gráfico de 1961 ano até 2015 ano Australia. Dados de 1960 ano ausente. O número de observações reais por data: 55.
Fonte (nome):
Indicadores de desenvolvimento mundial
Fonte (organização):
World Bank staff estimates based data from International Monetary Fund's Direction of Trade database.
Categorias:
Private Sector, Trade
Foi atualizado:
23 abr 2017 ano
Indicadores de alterações dos valores ao longo dos anos
Mínimo:
0.326
1 jan 1970 ano
Máximo:
1.321
1 jan 2012 ano
Na data de observação
Valor
Mudança absoluta
A alteração em relação ao valor anterior
1 jan 1961 ano
0.484
+0.484
0.0%
1 jan 1962 ano
0.362
-0.122
-25.18%
1 jan 1963 ano
0.492
+0.13
35.86%
1 jan 1964 ano
0.451
-0.04
-8.23%
1 jan 1965 ano
0.425
-0.026
-5.84%
1 jan 1966 ano
0.383
-0.042
-9.9%
1 jan 1967 ano
0.355
-0.028
-7.31%
1 jan 1968 ano
0.357
+0.002
0.51%
1 jan 1969 ano
0.504
+0.147
41.22%
1 jan 1970 ano
0.326
-0.178
-35.32%
1 jan 1971 ano
0.365
+0.039
11.95%
1 jan 1972 ano
0.418
+0.053
14.62%
1 jan 1973 ano
0.369
-0.049
-11.71%
1 jan 1974 ano
0.456
+0.087
23.66%
1 jan 1975 ano
0.578
+0.122
26.73%
1 jan 1976 ano
0.439
-0.14
-24.16%
1 jan 1977 ano
0.561
+0.122
27.88%
1 jan 1978 ano
0.53
-0.031
-5.5%
1 jan 1979 ano
0.64
+0.11
20.66%
1 jan 1980 ano
0.654
+0.015
2.27%
1 jan 1981 ano
0.727
+0.073
11.16%
1 jan 1982 ano
0.846
+0.119
16.37%
1 jan 1983 ano
0.861
+0.015
1.8%
1 jan 1984 ano
0.914
+0.053
6.17%
1 jan 1985 ano
1.109
+0.195
21.27%
1 jan 1986 ano
1.015
-0.094
-8.47%
1 jan 1987 ano
0.905
-0.11
-10.83%
1 jan 1988 ano
0.826
-0.079
-8.7%
1 jan 1989 ano
1.057
+0.23
27.85%
1 jan 1990 ano
1.072
+0.016
1.48%
1 jan 1991 ano
0.873
-0.199
-18.6%
1 jan 1992 ano
0.886
+0.013
1.54%
1 jan 1993 ano
0.836
-0.05
-5.66%
1 jan 1994 ano
0.805
-0.031
-3.71%
1 jan 1995 ano
0.845
+0.04
5.0%
1 jan 1996 ano
0.914
+0.069
8.18%
1 jan 1997 ano
0.783
-0.132
-14.39%
1 jan 1998 ano
0.767
-0.016
-2.01%
1 jan 1999 ano
0.738
-0.029
-3.76%
1 jan 2000 ano
0.805
+0.067
9.12%
1 jan 2001 ano
1.061
+0.255
31.7%
1 jan 2002 ano
1.081
+0.02
1.92%
1 jan 2003 ano
0.891
-0.191
-17.63%
1 jan 2004 ano
0.947
+0.057
6.35%
1 jan 2005 ano
0.985
+0.038
3.97%
1 jan 2006 ano
1.111
+0.126
12.81%
1 jan 2007 ano
1.194
+0.083
7.47%
1 jan 2008 ano
1.251
+0.057
4.8%
1 jan 2009 ano
1.314
+0.063
5.01%
1 jan 2010 ano
1.087
-0.227
-17.27%
1 jan 2011 ano
1.226
+0.139
12.79%
1 jan 2012 ano
1.321
+0.096
7.8%
1 jan 2013 ano
1.254
-0.068
-5.12%
1 jan 2014 ano
1.311
+0.057
4.54%
1 jan 2015 ano
1.241
-0.07
-5.36%
Classificação de países por estatísticas atuais por anos


Comentários: