29
/pt/
pt
AIzaSyAYiBZKx7MnpbEhh9jyipgxe19OcubqV5w
April 1, 2024
180151
Libya
LBY
true
2
1
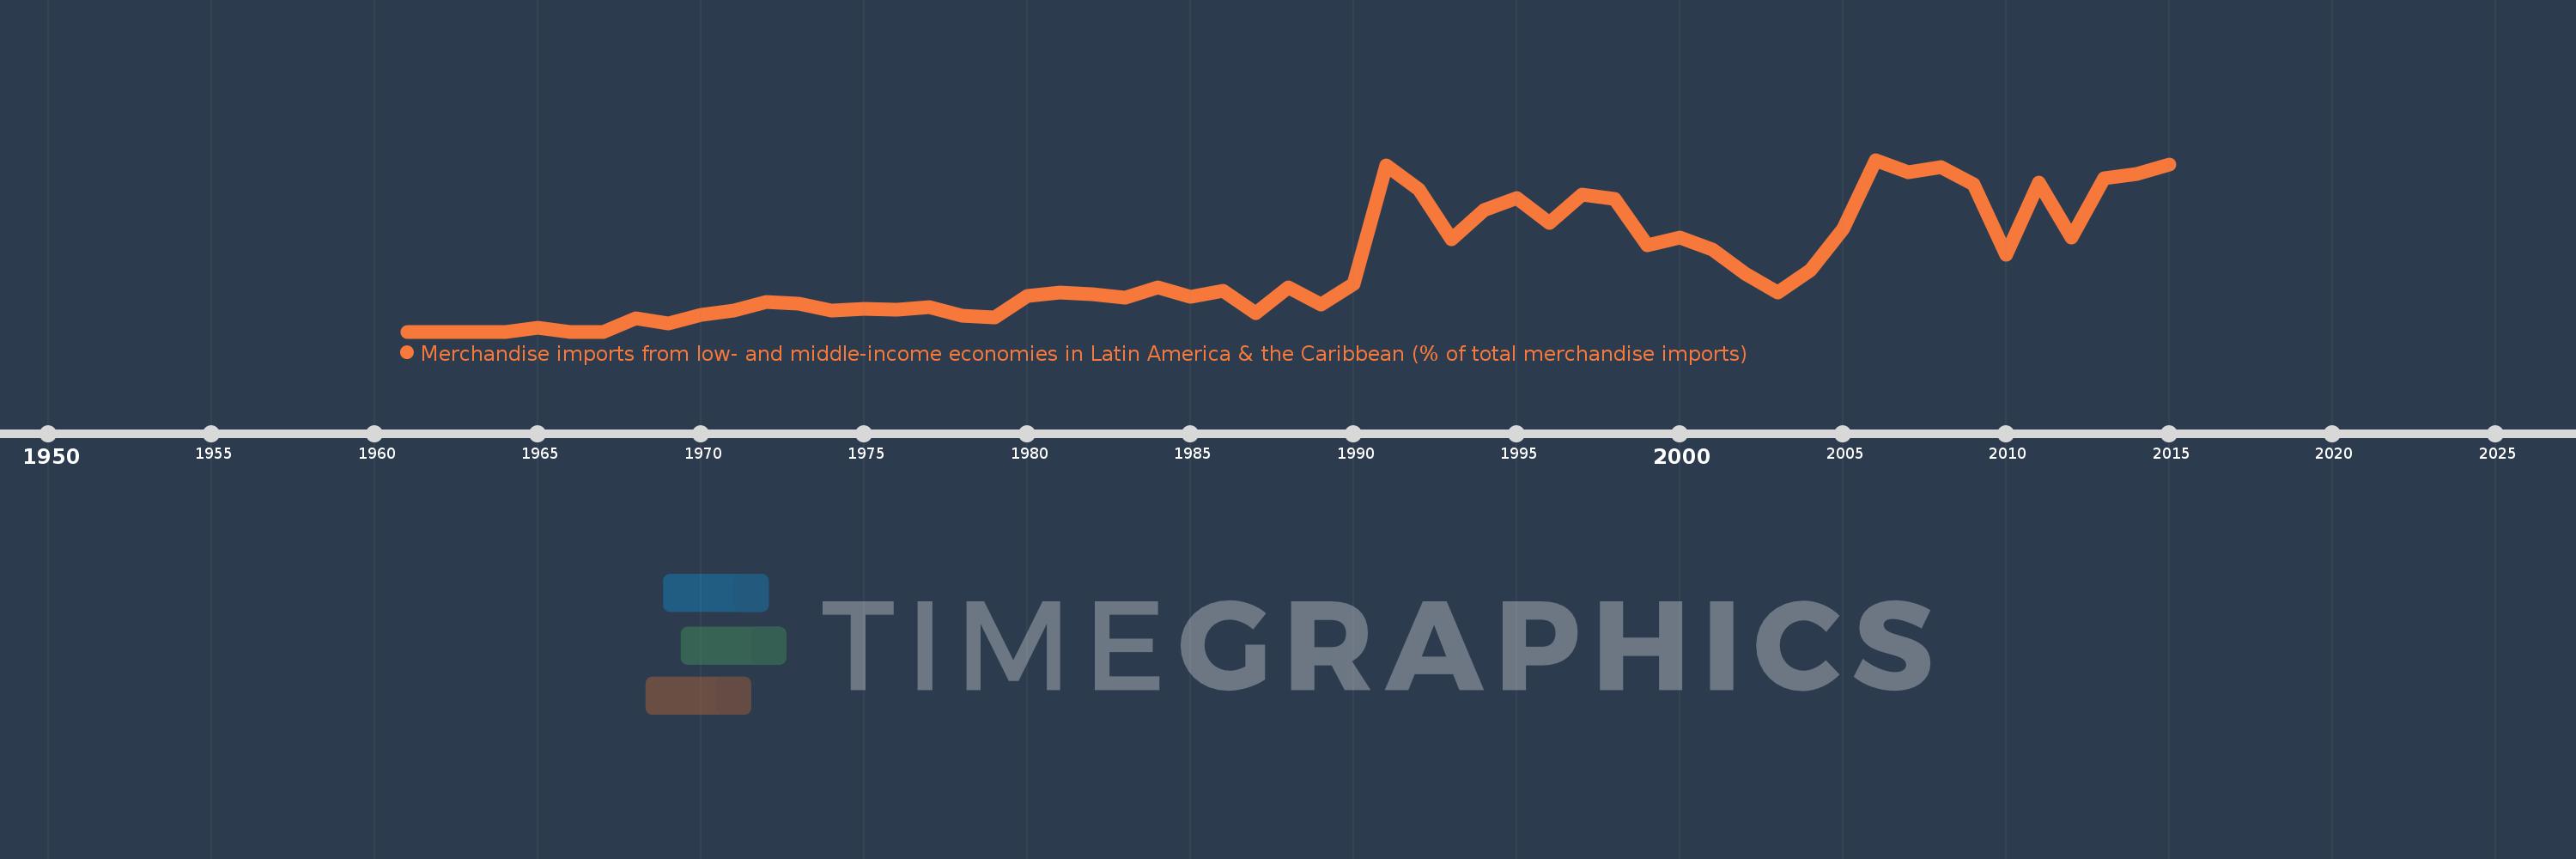
Merchandise imports from low- and middle-income economies in Latin America & the Caribbean (% of total merchandise imports)
2015,2014,2013,2012,2011,2010,2009,2008,2007,2006,2005,2004,2003,2002,2001,2000,1999,1998,1997,1996,1995,1994,1993,1992,1991,1990,1989,1988,1987,1986,1985,1984,1983,1982,1981,1980,1979,1978,1977,1976,1975,1974,1973,1972,1971,1970,1969,1968,1967,1966,1965,1964,1963,1962,1961
Estas estatísticas em outros países:
AfghanistanAlbaniaAlgeriaAngolaAntigua and BarbudaArab WorldArgentinaArmeniaArubaAustraliaAustriaAzerbaijanBahamas, TheBahrainBangladeshBarbadosBelarusBelgiumBelizeBeninBermudaBoliviaBrazilBrunei DarussalamBulgariaBurkina FasoCabo VerdeCambodiaCameroonCanadaCaribbean small statesCentral African RepublicCentral Europe and the BalticsChileChinaColombiaCongo, Dem. Rep.Congo, Rep.Costa RicaCote d'IvoireCroatiaCubaCyprusCzech RepublicDenmarkDominicaDominican RepublicEarly-demographic dividendEast Asia & PacificEast Asia & Pacific (excluding high income)East Asia & Pacific (IDA & IBRD countries)EcuadorEgypt, Arab Rep.El SalvadorEstoniaEthiopiaEuro areaEurope & Central AsiaEurope & Central Asia (excluding high income)Europe & Central Asia (IDA & IBRD countries)European UnionFaroe IslandsFijiFinlandFragile and conflict affected situationsFranceFrench PolynesiaGabonGambia, TheGeorgiaGermanyGhanaGibraltarGreeceGreenlandGrenadaGuatemalaGuineaGuyanaHaitiHeavily indebted poor countries (HIPC)High incomeHondurasHong Kong SAR, ChinaHungaryIBRD onlyIcelandIDA & IBRD totalIDA blendIDA onlyIDA totalIndiaIndonesiaIran, Islamic Rep.IraqIrelandIsraelItalyJamaicaJapanJordanKazakhstanKenyaKorea, Dem. People’s Rep.Korea, Rep.KuwaitKyrgyz RepublicLate-demographic dividendLatin America & Caribbean Latin America & Caribbean (excluding high income)Latin America & the Caribbean (IDA & IBRD countries)LatviaLeast developed countries: UN classificationLebanonLiberiaLibyaLithuaniaLow & middle incomeLow incomeLower middle incomeLuxembourgMacao SAR, ChinaMacedonia, FYRMadagascarMalawiMalaysiaMaldivesMaliMaltaMauritaniaMauritiusMexicoMiddle East & North AfricaMiddle East & North Africa (excluding high income)Middle East & North Africa (IDA & IBRD countries)Middle incomeMoldovaMongoliaMontenegroMoroccoMozambiqueNetherlandsNew CaledoniaNew ZealandNicaraguaNigerNigeriaNorth AmericaNorwayOECD membersOmanOther small statesPacific island small statesPakistanPanamaPapua New GuineaParaguayPeruPhilippinesPolandPortugalPost-demographic dividendPre-demographic dividendQatarRomaniaRussian FederationSaudi ArabiaSenegalSerbiaSierra LeoneSingaporeSlovak RepublicSloveniaSmall statesSomaliaSouth AfricaSouth AsiaSouth Asia (IDA & IBRD)SpainSri LankaSt. Kitts and NevisSt. LuciaSt. Vincent and the GrenadinesSub-Saharan Africa Sub-Saharan Africa (excluding high income)Sub-Saharan Africa (IDA & IBRD countries)SudanSurinameSwedenSwitzerlandSyrian Arab RepublicTanzaniaThailandTogoTrinidad and TobagoTunisiaTurkeyUgandaUkraineUnited Arab EmiratesUnited KingdomUnited StatesUpper middle incomeUruguayVenezuela, RBVietnamWorldYemen, Rep.ZambiaZimbabwe Linha do tempo:
Nesta escala de tempo está apresentado um gráfico de 1961 ano até 2015 ano Libya. Dados de 1960 ano ausente. O número de observações reais por data: 55.
Fonte (nome):
Indicadores de desenvolvimento mundial
Fonte (organização):
World Bank staff estimates based data from International Monetary Fund's Direction of Trade database.
Categorias:
Private Sector, Trade
Foi atualizado:
23 abr 2017 ano
Indicadores de alterações dos valores ao longo dos anos
Máximo:
2.772
1 jan 2006 ano
Na data de observação
Valor
Mudança absoluta
A alteração em relação ao valor anterior
1 jan 1961 ano
0.0
0.0
0.0%
1 jan 1965 ano
0.068
+0.068
%
1 jan 1966 ano
0.0
-0.068
-100.0%
1 jan 1968 ano
0.211
+0.211
%
1 jan 1969 ano
0.125
-0.086
-40.7%
1 jan 1970 ano
0.266
+0.142
113.28%
1 jan 1971 ano
0.342
+0.076
28.54%
1 jan 1972 ano
0.485
+0.142
41.59%
1 jan 1973 ano
0.45
-0.035
-7.2%
1 jan 1974 ano
0.342
-0.108
-23.9%
1 jan 1975 ano
0.373
+0.03
8.87%
1 jan 1976 ano
0.356
-0.017
-4.61%
1 jan 1977 ano
0.389
+0.034
9.43%
1 jan 1978 ano
0.256
-0.133
-34.1%
1 jan 1979 ano
0.228
-0.028
-11.03%
1 jan 1980 ano
0.569
+0.34
149.18%
1 jan 1981 ano
0.629
+0.06
10.56%
1 jan 1982 ano
0.606
-0.023
-3.6%
1 jan 1983 ano
0.544
-0.062
-10.28%
1 jan 1984 ano
0.712
+0.169
31.02%
1 jan 1985 ano
0.56
-0.153
-21.43%
1 jan 1986 ano
0.665
+0.106
18.87%
1 jan 1987 ano
0.295
-0.371
-55.7%
1 jan 1988 ano
0.718
+0.423
143.65%
1 jan 1989 ano
0.435
-0.283
-39.41%
1 jan 1990 ano
0.772
+0.337
77.54%
1 jan 1991 ano
2.687
+1.915
247.9%
1 jan 1992 ano
2.288
-0.399
-14.86%
1 jan 1993 ano
1.484
-0.804
-35.13%
1 jan 1994 ano
1.959
+0.475
31.99%
1 jan 1995 ano
2.152
+0.192
9.83%
1 jan 1996 ano
1.755
-0.397
-18.45%
1 jan 1997 ano
2.209
+0.454
25.89%
1 jan 1998 ano
2.142
-0.067
-3.05%
1 jan 1999 ano
1.392
-0.75
-35.01%
1 jan 2000 ano
1.517
+0.125
9.01%
1 jan 2001 ano
1.327
-0.19
-12.52%
1 jan 2002 ano
0.936
-0.391
-29.48%
1 jan 2003 ano
0.635
-0.301
-32.15%
1 jan 2004 ano
0.986
+0.351
55.27%
1 jan 2005 ano
1.65
+0.664
67.38%
1 jan 2006 ano
2.772
+1.121
67.95%
1 jan 2007 ano
2.565
-0.207
-7.46%
1 jan 2008 ano
2.661
+0.096
3.75%
1 jan 2009 ano
2.374
-0.288
-10.81%
1 jan 2010 ano
1.24
-1.133
-47.75%
1 jan 2011 ano
2.4
+1.16
93.5%
1 jan 2012 ano
1.512
-0.888
-37.0%
1 jan 2013 ano
2.473
+0.961
63.55%
1 jan 2014 ano
2.538
+0.065
2.64%
1 jan 2015 ano
2.697
+0.159
6.28%
Classificação de países por estatísticas atuais por anos


Comentários: