29
/pt/
pt
AIzaSyAYiBZKx7MnpbEhh9jyipgxe19OcubqV5w
April 1, 2024
143212
Grenada
GRD
true
2
1
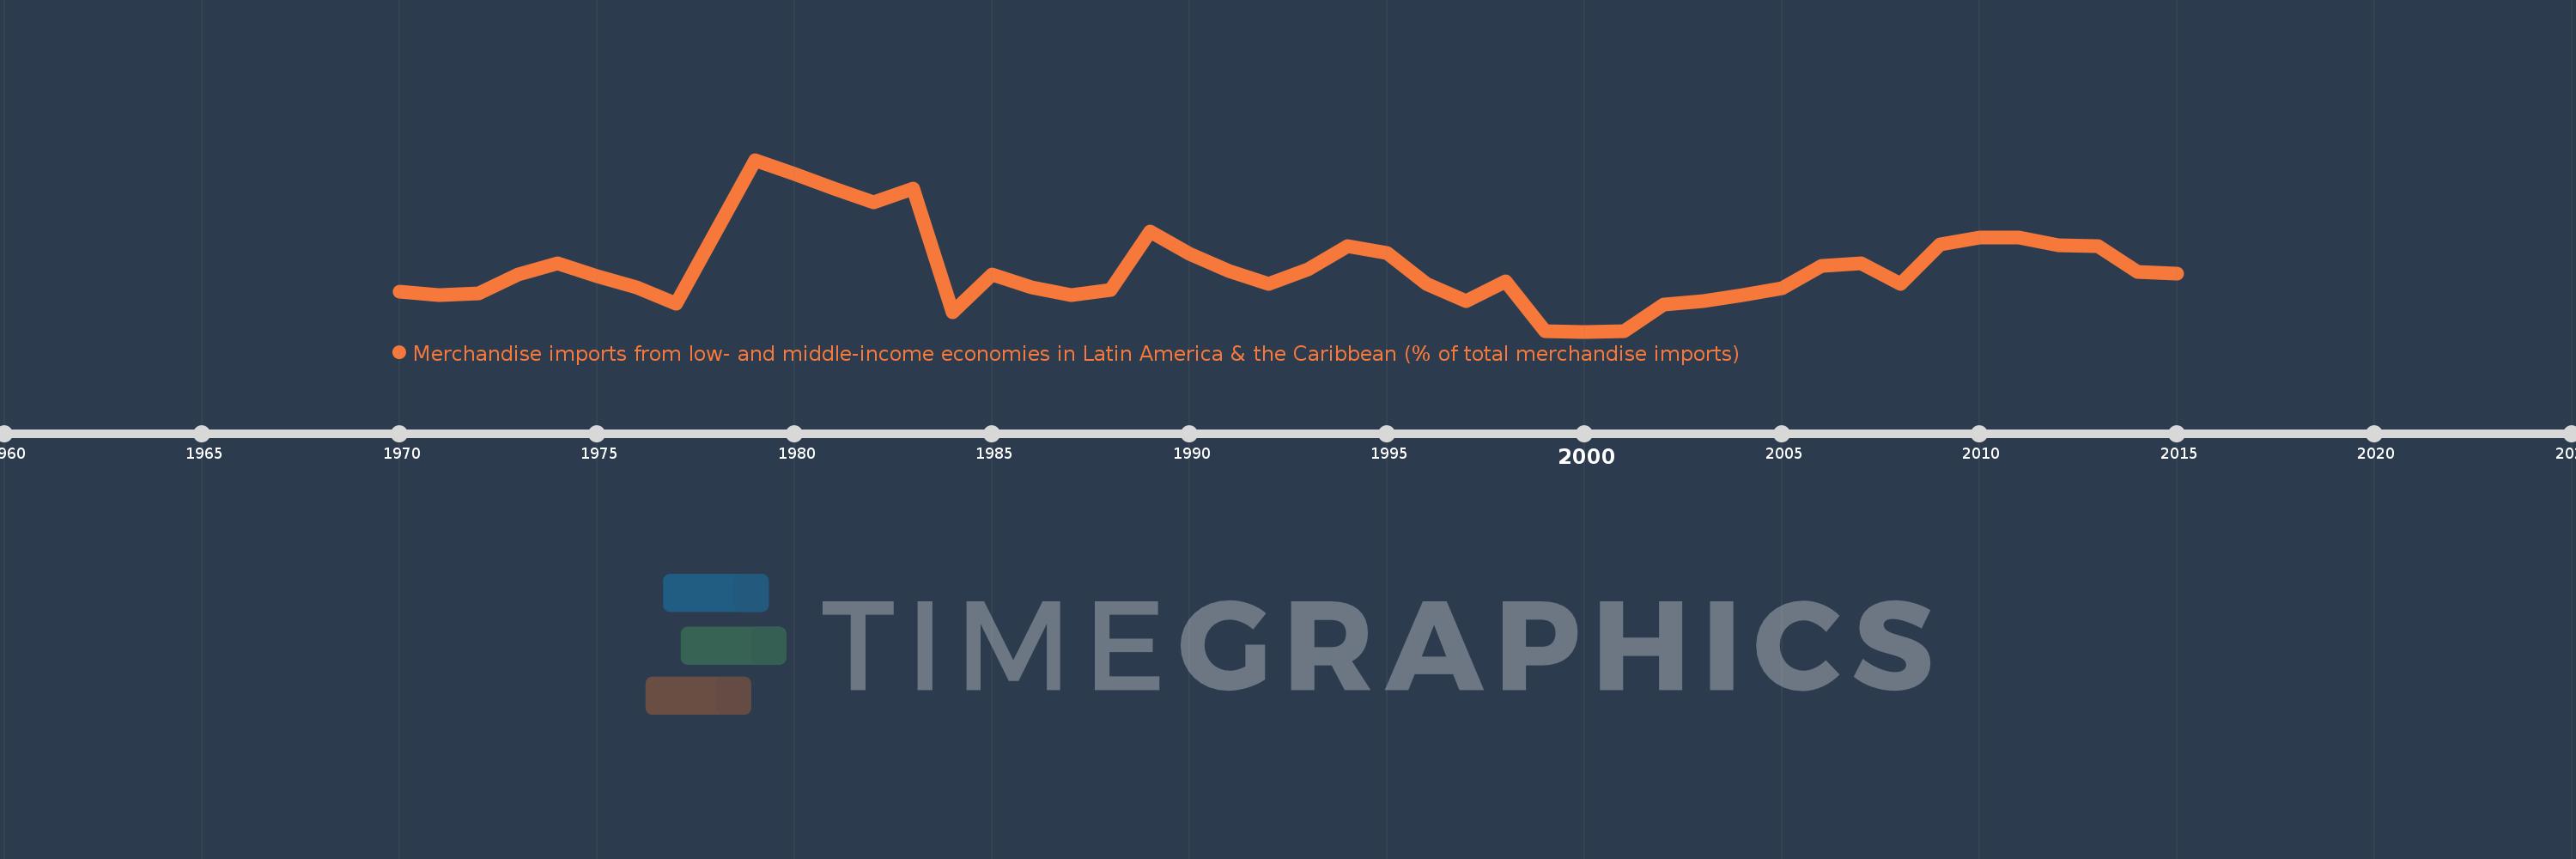
Merchandise imports from low- and middle-income economies in Latin America & the Caribbean (% of total merchandise imports)
2015,2014,2013,2012,2011,2010,2009,2008,2007,2006,2005,2004,2003,2002,2001,2000,1999,1998,1997,1996,1995,1994,1993,1992,1991,1990,1989,1988,1987,1986,1985,1984,1983,1982,1981,1980,1979,1977,1976,1975,1974,1973,1972,1971,1970
Estas estatísticas em outros países:
AfghanistanAlbaniaAlgeriaAngolaAntigua and BarbudaArab WorldArgentinaArmeniaArubaAustraliaAustriaAzerbaijanBahamas, TheBahrainBangladeshBarbadosBelarusBelgiumBelizeBeninBermudaBoliviaBrazilBrunei DarussalamBulgariaBurkina FasoCabo VerdeCambodiaCameroonCanadaCaribbean small statesCentral African RepublicCentral Europe and the BalticsChileChinaColombiaCongo, Dem. Rep.Congo, Rep.Costa RicaCote d'IvoireCroatiaCubaCyprusCzech RepublicDenmarkDominicaDominican RepublicEarly-demographic dividendEast Asia & PacificEast Asia & Pacific (excluding high income)East Asia & Pacific (IDA & IBRD countries)EcuadorEgypt, Arab Rep.El SalvadorEstoniaEthiopiaEuro areaEurope & Central AsiaEurope & Central Asia (excluding high income)Europe & Central Asia (IDA & IBRD countries)European UnionFaroe IslandsFijiFinlandFragile and conflict affected situationsFranceFrench PolynesiaGabonGambia, TheGeorgiaGermanyGhanaGibraltarGreeceGreenlandGrenadaGuatemalaGuineaGuyanaHaitiHeavily indebted poor countries (HIPC)High incomeHondurasHong Kong SAR, ChinaHungaryIBRD onlyIcelandIDA & IBRD totalIDA blendIDA onlyIDA totalIndiaIndonesiaIran, Islamic Rep.IraqIrelandIsraelItalyJamaicaJapanJordanKazakhstanKenyaKorea, Dem. People’s Rep.Korea, Rep.KuwaitKyrgyz RepublicLate-demographic dividendLatin America & Caribbean Latin America & Caribbean (excluding high income)Latin America & the Caribbean (IDA & IBRD countries)LatviaLeast developed countries: UN classificationLebanonLiberiaLibyaLithuaniaLow & middle incomeLow incomeLower middle incomeLuxembourgMacao SAR, ChinaMacedonia, FYRMadagascarMalawiMalaysiaMaldivesMaliMaltaMauritaniaMauritiusMexicoMiddle East & North AfricaMiddle East & North Africa (excluding high income)Middle East & North Africa (IDA & IBRD countries)Middle incomeMoldovaMongoliaMontenegroMoroccoMozambiqueNetherlandsNew CaledoniaNew ZealandNicaraguaNigerNigeriaNorth AmericaNorwayOECD membersOmanOther small statesPacific island small statesPakistanPanamaPapua New GuineaParaguayPeruPhilippinesPolandPortugalPost-demographic dividendPre-demographic dividendQatarRomaniaRussian FederationSaudi ArabiaSenegalSerbiaSierra LeoneSingaporeSlovak RepublicSloveniaSmall statesSomaliaSouth AfricaSouth AsiaSouth Asia (IDA & IBRD)SpainSri LankaSt. Kitts and NevisSt. LuciaSt. Vincent and the GrenadinesSub-Saharan Africa Sub-Saharan Africa (excluding high income)Sub-Saharan Africa (IDA & IBRD countries)SudanSurinameSwedenSwitzerlandSyrian Arab RepublicTanzaniaThailandTogoTrinidad and TobagoTunisiaTurkeyUgandaUkraineUnited Arab EmiratesUnited KingdomUnited StatesUpper middle incomeUruguayVenezuela, RBVietnamWorldYemen, Rep.ZambiaZimbabwe Linha do tempo:
Nesta escala de tempo está apresentado um gráfico de 1970 ano até 2015 ano Grenada. Dados de 1969 ano ausente. O número de observações reais por data: 45.
Fonte (nome):
Indicadores de desenvolvimento mundial
Fonte (organização):
World Bank staff estimates based data from International Monetary Fund's Direction of Trade database.
Categorias:
Private Sector, Trade
Foi atualizado:
23 abr 2017 ano
Indicadores de alterações dos valores ao longo dos anos
Mínimo:
3.218
1 jan 2000 ano
Máximo:
14.733
1 jan 1979 ano
Na data de observação
Valor
Mudança absoluta
A alteração em relação ao valor anterior
1 jan 1970 ano
5.873
+5.873
0.0%
1 jan 1971 ano
5.639
-0.235
-4.0%
1 jan 1972 ano
5.794
+0.155
2.75%
1 jan 1973 ano
7.059
+1.265
21.84%
1 jan 1974 ano
7.768
+0.709
10.04%
1 jan 1975 ano
6.936
-0.831
-10.7%
1 jan 1976 ano
6.164
-0.772
-11.13%
1 jan 1977 ano
5.11
-1.054
-17.1%
1 jan 1979 ano
14.733
+9.623
188.3%
1 jan 1980 ano
13.76
-0.972
-6.6%
1 jan 1981 ano
12.793
-0.967
-7.03%
1 jan 1982 ano
11.86
-0.933
-7.29%
1 jan 1983 ano
12.778
+0.918
7.74%
1 jan 1984 ano
4.537
-8.241
-64.49%
1 jan 1985 ano
7.026
+2.489
54.85%
1 jan 1986 ano
6.178
-0.848
-12.07%
1 jan 1987 ano
5.646
-0.533
-8.62%
1 jan 1988 ano
5.988
+0.343
6.07%
1 jan 1989 ano
9.954
+3.966
66.23%
1 jan 1990 ano
8.443
-1.511
-15.18%
1 jan 1991 ano
7.294
-1.149
-13.61%
1 jan 1992 ano
6.429
-0.865
-11.86%
1 jan 1993 ano
7.393
+0.963
14.99%
1 jan 1994 ano
8.973
+1.581
21.38%
1 jan 1995 ano
8.464
-0.509
-5.67%
1 jan 1996 ano
6.389
-2.076
-24.53%
1 jan 1997 ano
5.241
-1.148
-17.97%
1 jan 1998 ano
6.605
+1.364
26.03%
1 jan 1999 ano
3.236
-3.369
-51.01%
1 jan 2000 ano
3.218
-0.018
-0.55%
1 jan 2001 ano
3.237
+0.019
0.58%
1 jan 2002 ano
5.009
+1.772
54.74%
1 jan 2003 ano
5.252
+0.243
4.85%
1 jan 2004 ano
5.637
+0.385
7.34%
1 jan 2005 ano
6.142
+0.505
8.95%
1 jan 2006 ano
7.62
+1.478
24.06%
1 jan 2007 ano
7.824
+0.204
2.68%
1 jan 2008 ano
6.4
-1.424
-18.21%
1 jan 2009 ano
9.057
+2.657
41.52%
1 jan 2010 ano
9.501
+0.444
4.9%
1 jan 2011 ano
9.517
+0.016
0.17%
1 jan 2012 ano
8.998
-0.519
-5.45%
1 jan 2013 ano
8.958
-0.04
-0.45%
1 jan 2014 ano
7.248
-1.71
-19.08%
1 jan 2015 ano
7.107
-0.141
-1.95%
Classificação de países por estatísticas atuais por anos


Comentários: