29
/pt/
pt
AIzaSyAYiBZKx7MnpbEhh9jyipgxe19OcubqV5w
April 1, 2024
223867
Philippines
PHL
true
2
1
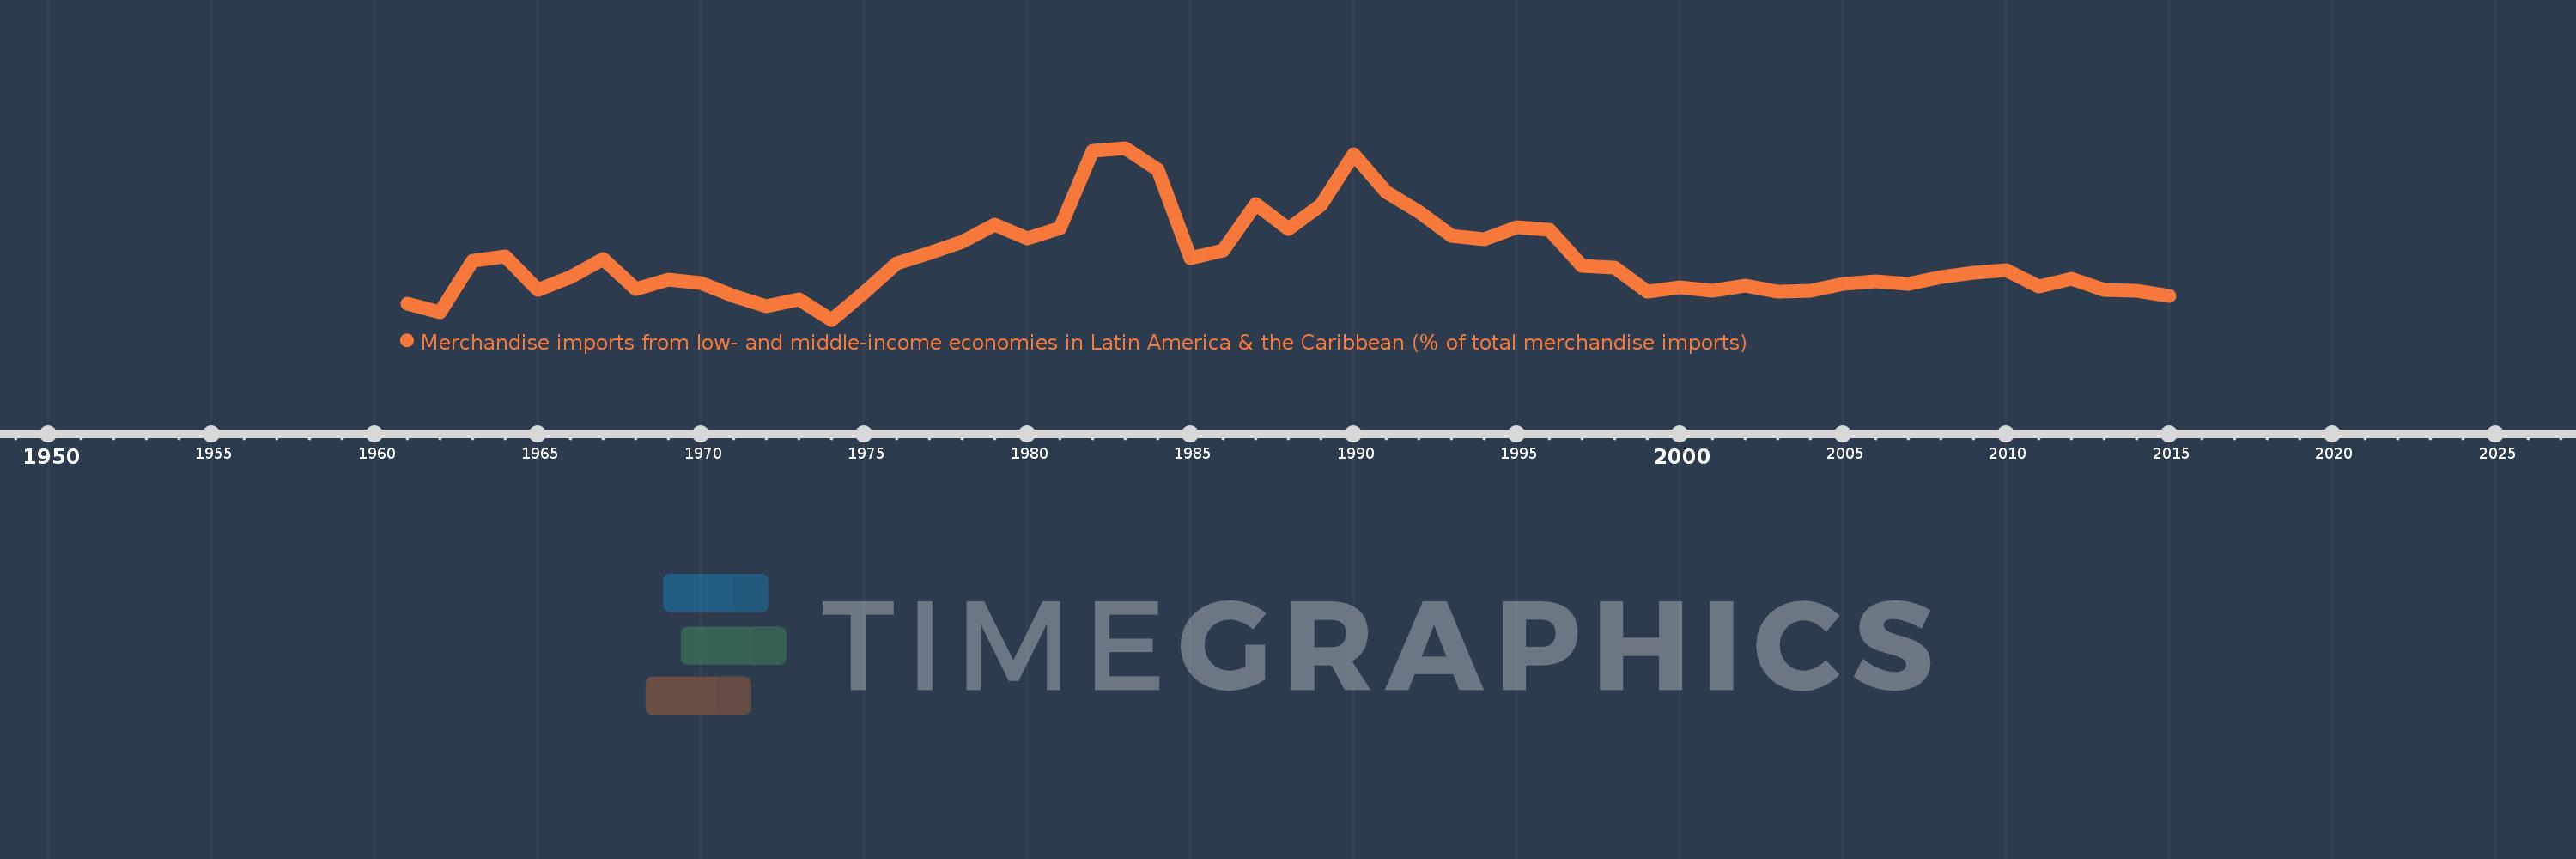
Merchandise imports from low- and middle-income economies in Latin America & the Caribbean (% of total merchandise imports)
2015,2014,2013,2012,2011,2010,2009,2008,2007,2006,2005,2004,2003,2002,2001,2000,1999,1998,1997,1996,1995,1994,1993,1992,1991,1990,1989,1988,1987,1986,1985,1984,1983,1982,1981,1980,1979,1978,1977,1976,1975,1974,1973,1972,1971,1970,1969,1968,1967,1966,1965,1964,1963,1962,1961
Estas estatísticas em outros países:
AfghanistanAlbaniaAlgeriaAngolaAntigua and BarbudaArab WorldArgentinaArmeniaArubaAustraliaAustriaAzerbaijanBahamas, TheBahrainBangladeshBarbadosBelarusBelgiumBelizeBeninBermudaBoliviaBrazilBrunei DarussalamBulgariaBurkina FasoCabo VerdeCambodiaCameroonCanadaCaribbean small statesCentral African RepublicCentral Europe and the BalticsChileChinaColombiaCongo, Dem. Rep.Congo, Rep.Costa RicaCote d'IvoireCroatiaCubaCyprusCzech RepublicDenmarkDominicaDominican RepublicEarly-demographic dividendEast Asia & PacificEast Asia & Pacific (excluding high income)East Asia & Pacific (IDA & IBRD countries)EcuadorEgypt, Arab Rep.El SalvadorEstoniaEthiopiaEuro areaEurope & Central AsiaEurope & Central Asia (excluding high income)Europe & Central Asia (IDA & IBRD countries)European UnionFaroe IslandsFijiFinlandFragile and conflict affected situationsFranceFrench PolynesiaGabonGambia, TheGeorgiaGermanyGhanaGibraltarGreeceGreenlandGrenadaGuatemalaGuineaGuyanaHaitiHeavily indebted poor countries (HIPC)High incomeHondurasHong Kong SAR, ChinaHungaryIBRD onlyIcelandIDA & IBRD totalIDA blendIDA onlyIDA totalIndiaIndonesiaIran, Islamic Rep.IraqIrelandIsraelItalyJamaicaJapanJordanKazakhstanKenyaKorea, Dem. People’s Rep.Korea, Rep.KuwaitKyrgyz RepublicLate-demographic dividendLatin America & Caribbean Latin America & Caribbean (excluding high income)Latin America & the Caribbean (IDA & IBRD countries)LatviaLeast developed countries: UN classificationLebanonLiberiaLibyaLithuaniaLow & middle incomeLow incomeLower middle incomeLuxembourgMacao SAR, ChinaMacedonia, FYRMadagascarMalawiMalaysiaMaldivesMaliMaltaMauritaniaMauritiusMexicoMiddle East & North AfricaMiddle East & North Africa (excluding high income)Middle East & North Africa (IDA & IBRD countries)Middle incomeMoldovaMongoliaMontenegroMoroccoMozambiqueNetherlandsNew CaledoniaNew ZealandNicaraguaNigerNigeriaNorth AmericaNorwayOECD membersOmanOther small statesPacific island small statesPakistanPanamaPapua New GuineaParaguayPeruPhilippinesPolandPortugalPost-demographic dividendPre-demographic dividendQatarRomaniaRussian FederationSaudi ArabiaSenegalSerbiaSierra LeoneSingaporeSlovak RepublicSloveniaSmall statesSomaliaSouth AfricaSouth AsiaSouth Asia (IDA & IBRD)SpainSri LankaSt. Kitts and NevisSt. LuciaSt. Vincent and the GrenadinesSub-Saharan Africa Sub-Saharan Africa (excluding high income)Sub-Saharan Africa (IDA & IBRD countries)SudanSurinameSwedenSwitzerlandSyrian Arab RepublicTanzaniaThailandTogoTrinidad and TobagoTunisiaTurkeyUgandaUkraineUnited Arab EmiratesUnited KingdomUnited StatesUpper middle incomeUruguayVenezuela, RBVietnamWorldYemen, Rep.ZambiaZimbabwe Linha do tempo:
Nesta escala de tempo está apresentado um gráfico de 1961 ano até 2015 ano Philippines. Dados de 1960 ano ausente. O número de observações reais por data: 55.
Fonte (nome):
Indicadores de desenvolvimento mundial
Fonte (organização):
World Bank staff estimates based data from International Monetary Fund's Direction of Trade database.
Categorias:
Private Sector, Trade
Foi atualizado:
23 abr 2017 ano
Indicadores de alterações dos valores ao longo dos anos
Mínimo:
0.106
1 jan 1974 ano
Máximo:
2.756
1 jan 1983 ano
Na data de observação
Valor
Mudança absoluta
A alteração em relação ao valor anterior
1 jan 1961 ano
0.351
+0.351
0.0%
1 jan 1962 ano
0.222
-0.13
-36.86%
1 jan 1963 ano
1.021
+0.799
359.87%
1 jan 1964 ano
1.079
+0.059
5.75%
1 jan 1965 ano
0.56
-0.519
-48.13%
1 jan 1966 ano
0.762
+0.202
36.05%
1 jan 1967 ano
1.045
+0.284
37.27%
1 jan 1968 ano
0.581
-0.464
-44.43%
1 jan 1969 ano
0.72
+0.139
23.94%
1 jan 1970 ano
0.675
-0.045
-6.2%
1 jan 1971 ano
0.473
-0.202
-29.93%
1 jan 1972 ano
0.309
-0.164
-34.75%
1 jan 1973 ano
0.418
+0.109
35.37%
1 jan 1974 ano
0.106
-0.312
-74.6%
1 jan 1975 ano
0.531
+0.425
400.58%
1 jan 1976 ano
0.983
+0.452
84.98%
1 jan 1977 ano
1.141
+0.158
16.09%
1 jan 1978 ano
1.313
+0.172
15.03%
1 jan 1979 ano
1.572
+0.26
19.78%
1 jan 1980 ano
1.359
-0.213
-13.58%
1 jan 1981 ano
1.518
+0.159
11.71%
1 jan 1982 ano
2.716
+1.198
78.9%
1 jan 1983 ano
2.756
+0.04
1.48%
1 jan 1984 ano
2.424
-0.332
-12.04%
1 jan 1985 ano
1.062
-1.362
-56.18%
1 jan 1986 ano
1.176
+0.113
10.65%
1 jan 1987 ano
1.89
+0.714
60.73%
1 jan 1988 ano
1.503
-0.386
-20.43%
1 jan 1989 ano
1.879
+0.375
24.96%
1 jan 1990 ano
2.662
+0.783
41.7%
1 jan 1991 ano
2.076
-0.586
-22.03%
1 jan 1992 ano
1.766
-0.31
-14.93%
1 jan 1993 ano
1.401
-0.365
-20.68%
1 jan 1994 ano
1.343
-0.057
-4.09%
1 jan 1995 ano
1.53
+0.186
13.86%
1 jan 1996 ano
1.499
-0.03
-1.99%
1 jan 1997 ano
0.941
-0.558
-37.2%
1 jan 1998 ano
0.911
-0.03
-3.18%
1 jan 1999 ano
0.537
-0.375
-41.14%
1 jan 2000 ano
0.61
+0.073
13.69%
1 jan 2001 ano
0.558
-0.052
-8.49%
1 jan 2002 ano
0.633
+0.075
13.41%
1 jan 2003 ano
0.535
-0.098
-15.45%
1 jan 2004 ano
0.551
+0.016
3.01%
1 jan 2005 ano
0.66
+0.108
19.66%
1 jan 2006 ano
0.703
+0.043
6.59%
1 jan 2007 ano
0.665
-0.038
-5.36%
1 jan 2008 ano
0.765
+0.1
15.03%
1 jan 2009 ano
0.829
+0.064
8.31%
1 jan 2010 ano
0.864
+0.034
4.16%
1 jan 2011 ano
0.623
-0.241
-27.89%
1 jan 2012 ano
0.736
+0.113
18.17%
1 jan 2013 ano
0.562
-0.174
-23.66%
1 jan 2014 ano
0.557
-0.005
-0.88%
1 jan 2015 ano
0.471
-0.086
-15.4%
Classificação de países por estatísticas atuais por anos


Comentários: