29
/pt/
pt
AIzaSyAYiBZKx7MnpbEhh9jyipgxe19OcubqV5w
April 1, 2024
275946
United Kingdom
GBR
true
2
1
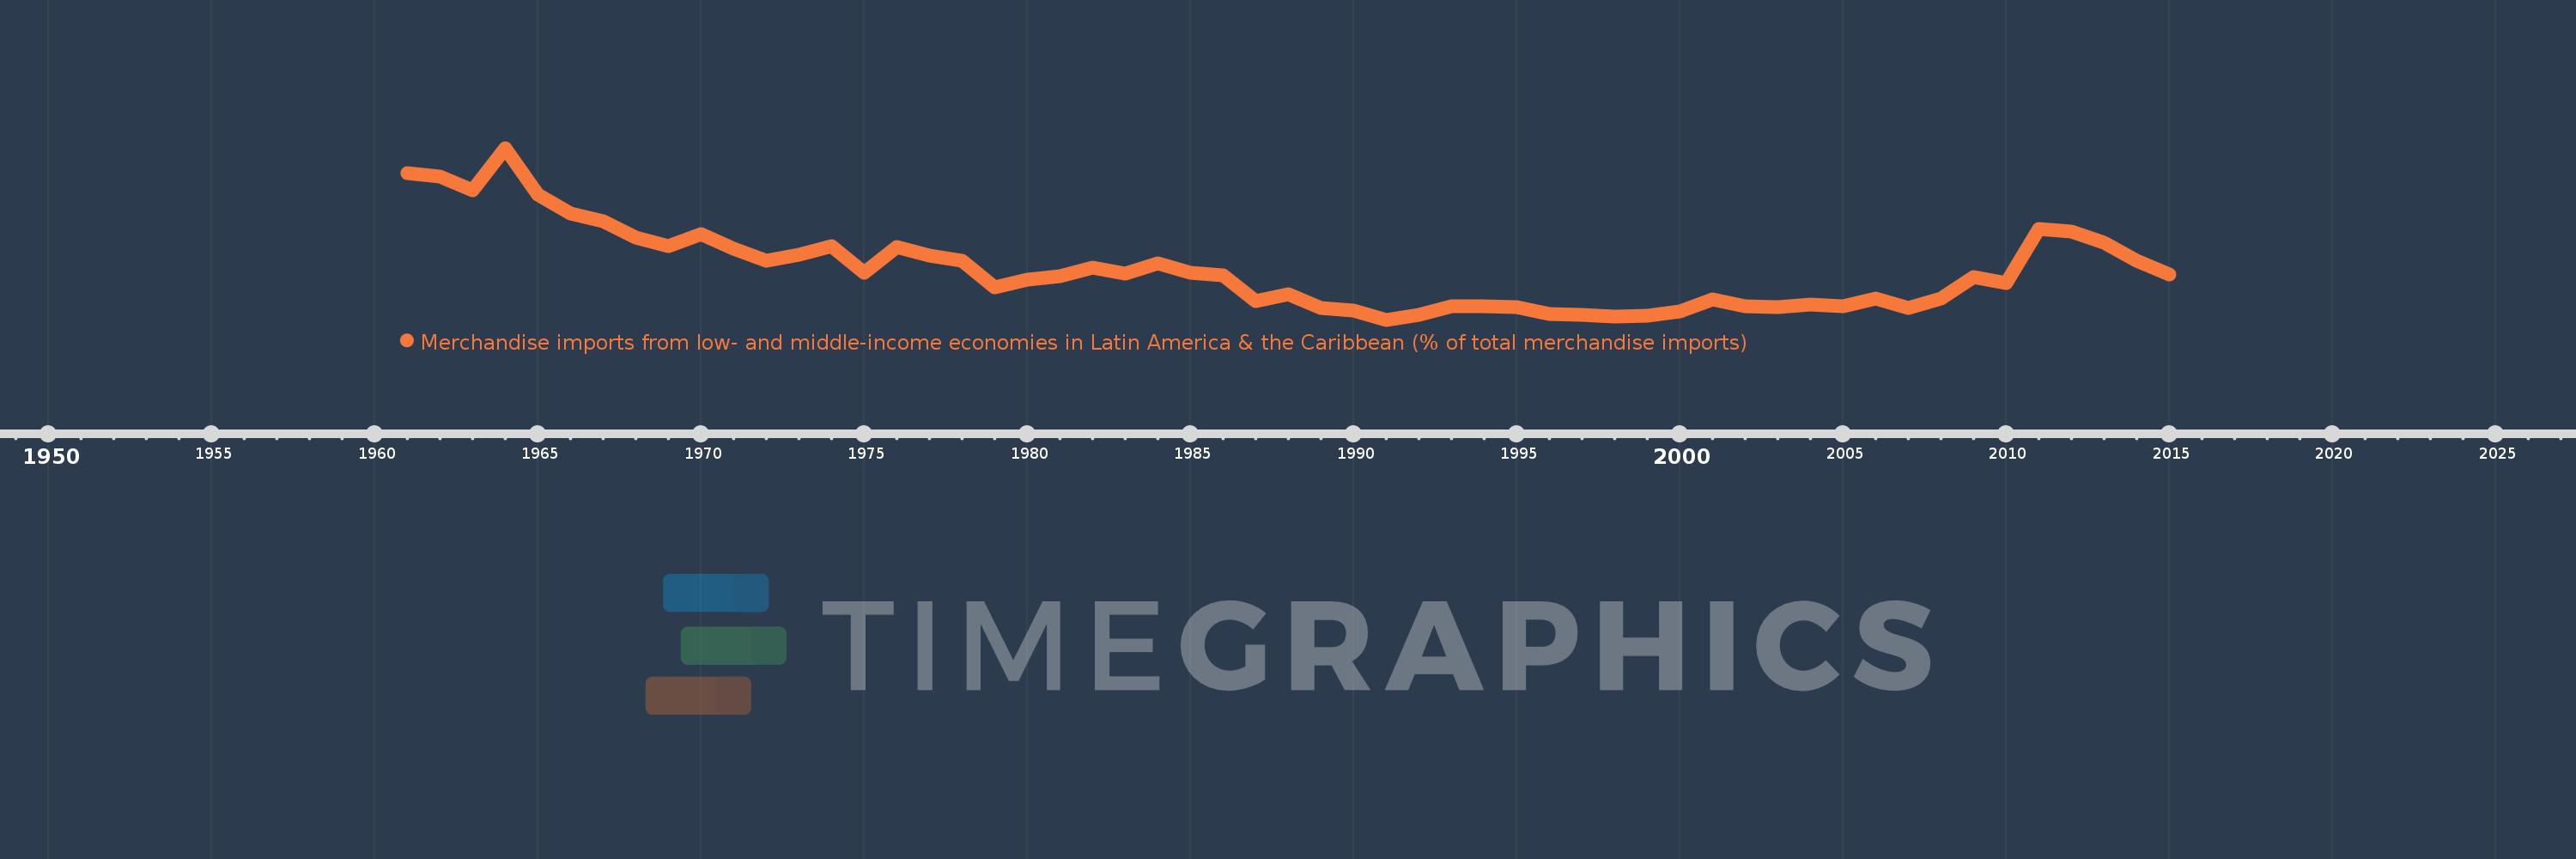
Merchandise imports from low- and middle-income economies in Latin America & the Caribbean (% of total merchandise imports)
2015,2014,2013,2012,2011,2010,2009,2008,2007,2006,2005,2004,2003,2002,2001,2000,1999,1998,1997,1996,1995,1994,1993,1992,1991,1990,1989,1988,1987,1986,1985,1984,1983,1982,1981,1980,1979,1978,1977,1976,1975,1974,1973,1972,1971,1970,1969,1968,1967,1966,1965,1964,1963,1962,1961
Estas estatísticas em outros países:
AfghanistanAlbaniaAlgeriaAngolaAntigua and BarbudaArab WorldArgentinaArmeniaArubaAustraliaAustriaAzerbaijanBahamas, TheBahrainBangladeshBarbadosBelarusBelgiumBelizeBeninBermudaBoliviaBrazilBrunei DarussalamBulgariaBurkina FasoCabo VerdeCambodiaCameroonCanadaCaribbean small statesCentral African RepublicCentral Europe and the BalticsChileChinaColombiaCongo, Dem. Rep.Congo, Rep.Costa RicaCote d'IvoireCroatiaCubaCyprusCzech RepublicDenmarkDominicaDominican RepublicEarly-demographic dividendEast Asia & PacificEast Asia & Pacific (excluding high income)East Asia & Pacific (IDA & IBRD countries)EcuadorEgypt, Arab Rep.El SalvadorEstoniaEthiopiaEuro areaEurope & Central AsiaEurope & Central Asia (excluding high income)Europe & Central Asia (IDA & IBRD countries)European UnionFaroe IslandsFijiFinlandFragile and conflict affected situationsFranceFrench PolynesiaGabonGambia, TheGeorgiaGermanyGhanaGibraltarGreeceGreenlandGrenadaGuatemalaGuineaGuyanaHaitiHeavily indebted poor countries (HIPC)High incomeHondurasHong Kong SAR, ChinaHungaryIBRD onlyIcelandIDA & IBRD totalIDA blendIDA onlyIDA totalIndiaIndonesiaIran, Islamic Rep.IraqIrelandIsraelItalyJamaicaJapanJordanKazakhstanKenyaKorea, Dem. People’s Rep.Korea, Rep.KuwaitKyrgyz RepublicLate-demographic dividendLatin America & Caribbean Latin America & Caribbean (excluding high income)Latin America & the Caribbean (IDA & IBRD countries)LatviaLeast developed countries: UN classificationLebanonLiberiaLibyaLithuaniaLow & middle incomeLow incomeLower middle incomeLuxembourgMacao SAR, ChinaMacedonia, FYRMadagascarMalawiMalaysiaMaldivesMaliMaltaMauritaniaMauritiusMexicoMiddle East & North AfricaMiddle East & North Africa (excluding high income)Middle East & North Africa (IDA & IBRD countries)Middle incomeMoldovaMongoliaMontenegroMoroccoMozambiqueNetherlandsNew CaledoniaNew ZealandNicaraguaNigerNigeriaNorth AmericaNorwayOECD membersOmanOther small statesPacific island small statesPakistanPanamaPapua New GuineaParaguayPeruPhilippinesPolandPortugalPost-demographic dividendPre-demographic dividendQatarRomaniaRussian FederationSaudi ArabiaSenegalSerbiaSierra LeoneSingaporeSlovak RepublicSloveniaSmall statesSomaliaSouth AfricaSouth AsiaSouth Asia (IDA & IBRD)SpainSri LankaSt. Kitts and NevisSt. LuciaSt. Vincent and the GrenadinesSub-Saharan Africa Sub-Saharan Africa (excluding high income)Sub-Saharan Africa (IDA & IBRD countries)SudanSurinameSwedenSwitzerlandSyrian Arab RepublicTanzaniaThailandTogoTrinidad and TobagoTunisiaTurkeyUgandaUkraineUnited Arab EmiratesUnited KingdomUnited StatesUpper middle incomeUruguayVenezuela, RBVietnamWorldYemen, Rep.ZambiaZimbabwe Linha do tempo:
Nesta escala de tempo está apresentado um gráfico de 1961 ano até 2015 ano United Kingdom. Dados de 1960 ano ausente. O número de observações reais por data: 55.
Fonte (nome):
Indicadores de desenvolvimento mundial
Fonte (organização):
World Bank staff estimates based data from International Monetary Fund's Direction of Trade database.
Categorias:
Private Sector, Trade
Foi atualizado:
23 abr 2017 ano
Indicadores de alterações dos valores ao longo dos anos
Mínimo:
1.234
1 jan 1991 ano
Máximo:
3.038
1 jan 1964 ano
Na data de observação
Valor
Mudança absoluta
A alteração em relação ao valor anterior
1 jan 1961 ano
2.778
+2.778
0.0%
1 jan 1962 ano
2.734
-0.044
-1.58%
1 jan 1963 ano
2.596
-0.138
-5.04%
1 jan 1964 ano
3.038
+0.442
17.01%
1 jan 1965 ano
2.546
-0.492
-16.19%
1 jan 1966 ano
2.346
-0.2
-7.86%
1 jan 1967 ano
2.268
-0.078
-3.32%
1 jan 1968 ano
2.099
-0.169
-7.47%
1 jan 1969 ano
2.005
-0.094
-4.47%
1 jan 1970 ano
2.13
+0.125
6.25%
1 jan 1971 ano
1.98
-0.15
-7.03%
1 jan 1972 ano
1.858
-0.123
-6.21%
1 jan 1973 ano
1.92
+0.062
3.34%
1 jan 1974 ano
2.004
+0.085
4.41%
1 jan 1975 ano
1.73
-0.274
-13.7%
1 jan 1976 ano
1.994
+0.264
15.27%
1 jan 1977 ano
1.909
-0.085
-4.28%
1 jan 1978 ano
1.858
-0.051
-2.66%
1 jan 1979 ano
1.57
-0.288
-15.48%
1 jan 1980 ano
1.652
+0.081
5.18%
1 jan 1981 ano
1.694
+0.042
2.54%
1 jan 1982 ano
1.781
+0.087
5.14%
1 jan 1983 ano
1.719
-0.062
-3.46%
1 jan 1984 ano
1.831
+0.112
6.51%
1 jan 1985 ano
1.726
-0.105
-5.73%
1 jan 1986 ano
1.7
-0.026
-1.51%
1 jan 1987 ano
1.426
-0.274
-16.13%
1 jan 1988 ano
1.499
+0.073
5.16%
1 jan 1989 ano
1.354
-0.145
-9.68%
1 jan 1990 ano
1.33
-0.024
-1.75%
1 jan 1991 ano
1.234
-0.096
-7.21%
1 jan 1992 ano
1.285
+0.051
4.12%
1 jan 1993 ano
1.378
+0.092
7.18%
1 jan 1994 ano
1.379
+0.002
0.13%
1 jan 1995 ano
1.364
-0.015
-1.09%
1 jan 1996 ano
1.29
-0.074
-5.44%
1 jan 1997 ano
1.284
-0.006
-0.48%
1 jan 1998 ano
1.266
-0.018
-1.38%
1 jan 1999 ano
1.276
+0.01
0.77%
1 jan 2000 ano
1.325
+0.05
3.89%
1 jan 2001 ano
1.448
+0.123
9.28%
1 jan 2002 ano
1.38
-0.068
-4.71%
1 jan 2003 ano
1.366
-0.014
-1.04%
1 jan 2004 ano
1.391
+0.025
1.87%
1 jan 2005 ano
1.374
-0.018
-1.27%
1 jan 2006 ano
1.456
+0.082
6.0%
1 jan 2007 ano
1.356
-0.1
-6.9%
1 jan 2008 ano
1.456
+0.1
7.37%
1 jan 2009 ano
1.685
+0.229
15.76%
1 jan 2010 ano
1.619
-0.066
-3.92%
1 jan 2011 ano
2.188
+0.569
35.18%
1 jan 2012 ano
2.16
-0.029
-1.3%
1 jan 2013 ano
2.042
-0.118
-5.46%
1 jan 2014 ano
1.855
-0.187
-9.14%
1 jan 2015 ano
1.707
-0.148
-7.99%
Classificação de países por estatísticas atuais por anos


Comentários: