29
/pt/
pt
AIzaSyAYiBZKx7MnpbEhh9jyipgxe19OcubqV5w
April 1, 2024
54993
Post-demographic dividend
PST
false
2
1
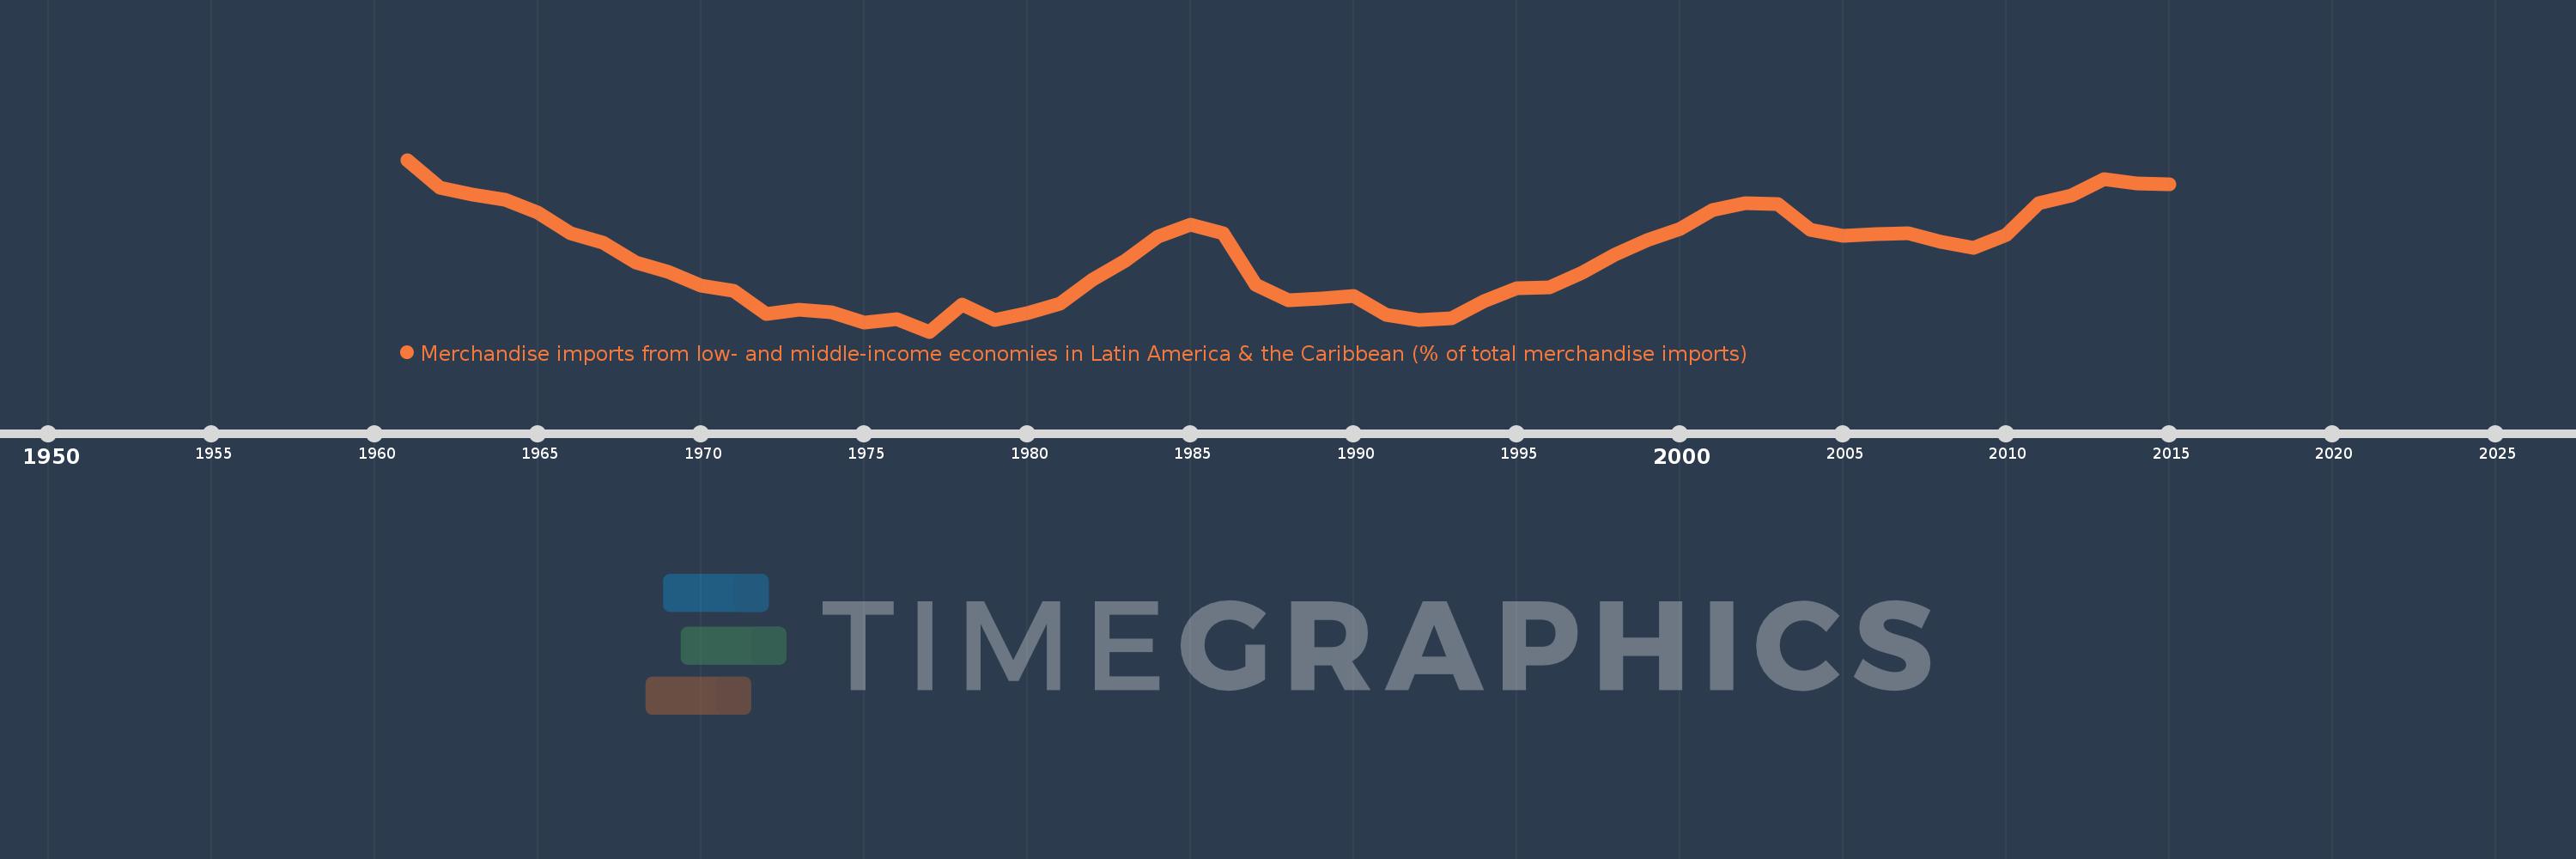
Merchandise imports from low- and middle-income economies in Latin America & the Caribbean (% of total merchandise imports)
2015,2014,2013,2012,2011,2010,2009,2008,2007,2006,2005,2004,2003,2002,2001,2000,1999,1998,1997,1996,1995,1994,1993,1992,1991,1990,1989,1988,1987,1986,1985,1984,1983,1982,1981,1980,1979,1978,1977,1976,1975,1974,1973,1972,1971,1970,1969,1968,1967,1966,1965,1964,1963,1962,1961
Estas estatísticas em outros países:
AfghanistanAlbaniaAlgeriaAngolaAntigua and BarbudaArab WorldArgentinaArmeniaArubaAustraliaAustriaAzerbaijanBahamas, TheBahrainBangladeshBarbadosBelarusBelgiumBelizeBeninBermudaBoliviaBrazilBrunei DarussalamBulgariaBurkina FasoCabo VerdeCambodiaCameroonCanadaCaribbean small statesCentral African RepublicCentral Europe and the BalticsChileChinaColombiaCongo, Dem. Rep.Congo, Rep.Costa RicaCote d'IvoireCroatiaCubaCyprusCzech RepublicDenmarkDominicaDominican RepublicEarly-demographic dividendEast Asia & PacificEast Asia & Pacific (excluding high income)East Asia & Pacific (IDA & IBRD countries)EcuadorEgypt, Arab Rep.El SalvadorEstoniaEthiopiaEuro areaEurope & Central AsiaEurope & Central Asia (excluding high income)Europe & Central Asia (IDA & IBRD countries)European UnionFaroe IslandsFijiFinlandFragile and conflict affected situationsFranceFrench PolynesiaGabonGambia, TheGeorgiaGermanyGhanaGibraltarGreeceGreenlandGrenadaGuatemalaGuineaGuyanaHaitiHeavily indebted poor countries (HIPC)High incomeHondurasHong Kong SAR, ChinaHungaryIBRD onlyIcelandIDA & IBRD totalIDA blendIDA onlyIDA totalIndiaIndonesiaIran, Islamic Rep.IraqIrelandIsraelItalyJamaicaJapanJordanKazakhstanKenyaKorea, Dem. People’s Rep.Korea, Rep.KuwaitKyrgyz RepublicLate-demographic dividendLatin America & Caribbean Latin America & Caribbean (excluding high income)Latin America & the Caribbean (IDA & IBRD countries)LatviaLeast developed countries: UN classificationLebanonLiberiaLibyaLithuaniaLow & middle incomeLow incomeLower middle incomeLuxembourgMacao SAR, ChinaMacedonia, FYRMadagascarMalawiMalaysiaMaldivesMaliMaltaMauritaniaMauritiusMexicoMiddle East & North AfricaMiddle East & North Africa (excluding high income)Middle East & North Africa (IDA & IBRD countries)Middle incomeMoldovaMongoliaMontenegroMoroccoMozambiqueNetherlandsNew CaledoniaNew ZealandNicaraguaNigerNigeriaNorth AmericaNorwayOECD membersOmanOther small statesPacific island small statesPakistanPanamaPapua New GuineaParaguayPeruPhilippinesPolandPortugalPost-demographic dividendPre-demographic dividendQatarRomaniaRussian FederationSaudi ArabiaSenegalSerbiaSierra LeoneSingaporeSlovak RepublicSloveniaSmall statesSomaliaSouth AfricaSouth AsiaSouth Asia (IDA & IBRD)SpainSri LankaSt. Kitts and NevisSt. LuciaSt. Vincent and the GrenadinesSub-Saharan Africa Sub-Saharan Africa (excluding high income)Sub-Saharan Africa (IDA & IBRD countries)SudanSurinameSwedenSwitzerlandSyrian Arab RepublicTanzaniaThailandTogoTrinidad and TobagoTunisiaTurkeyUgandaUkraineUnited Arab EmiratesUnited KingdomUnited StatesUpper middle incomeUruguayVenezuela, RBVietnamWorldYemen, Rep.ZambiaZimbabwe Linha do tempo:
Nesta escala de tempo está apresentado um gráfico de 1961 ano até 2015 ano Post-demographic dividend. Dados de 1960 ano ausente. O número de observações reais por data: 55.
Fonte (nome):
Indicadores de desenvolvimento mundial
Fonte (organização):
World Bank staff estimates based data from International Monetary Fund's Direction of Trade database.
Categorias:
Private Sector, Trade
Foi atualizado:
23 abr 2017 ano
Indicadores de alterações dos valores ao longo dos anos
Mínimo:
3.105
1 jan 1977 ano
Máximo:
5.54
1 jan 1961 ano
Na data de observação
Valor
Mudança absoluta
A alteração em relação ao valor anterior
1 jan 1961 ano
5.54
+5.54
0.0%
1 jan 1962 ano
5.149
-0.39
-7.04%
1 jan 1963 ano
5.053
-0.097
-1.88%
1 jan 1964 ano
4.972
-0.081
-1.6%
1 jan 1965 ano
4.797
-0.175
-3.52%
1 jan 1966 ano
4.493
-0.305
-6.35%
1 jan 1967 ano
4.369
-0.123
-2.75%
1 jan 1968 ano
4.088
-0.281
-6.44%
1 jan 1969 ano
3.954
-0.134
-3.28%
1 jan 1970 ano
3.761
-0.193
-4.88%
1 jan 1971 ano
3.689
-0.072
-1.9%
1 jan 1972 ano
3.351
-0.338
-9.16%
1 jan 1973 ano
3.421
+0.07
2.08%
1 jan 1974 ano
3.383
-0.038
-1.1%
1 jan 1975 ano
3.227
-0.156
-4.62%
1 jan 1976 ano
3.276
+0.049
1.53%
1 jan 1977 ano
3.105
-0.171
-5.23%
1 jan 1978 ano
3.493
+0.388
12.5%
1 jan 1979 ano
3.271
-0.222
-6.35%
1 jan 1980 ano
3.369
+0.098
3.0%
1 jan 1981 ano
3.506
+0.137
4.08%
1 jan 1982 ano
3.841
+0.334
9.53%
1 jan 1983 ano
4.106
+0.265
6.9%
1 jan 1984 ano
4.453
+0.347
8.45%
1 jan 1985 ano
4.626
+0.173
3.89%
1 jan 1986 ano
4.503
-0.122
-2.64%
1 jan 1987 ano
3.764
-0.74
-16.43%
1 jan 1988 ano
3.551
-0.212
-5.64%
1 jan 1989 ano
3.576
+0.025
0.7%
1 jan 1990 ano
3.614
+0.038
1.05%
1 jan 1991 ano
3.348
-0.266
-7.36%
1 jan 1992 ano
3.274
-0.074
-2.22%
1 jan 1993 ano
3.295
+0.021
0.65%
1 jan 1994 ano
3.543
+0.248
7.52%
1 jan 1995 ano
3.725
+0.183
5.16%
1 jan 1996 ano
3.726
+0.0
0.0%
1 jan 1997 ano
3.939
+0.214
5.74%
1 jan 1998 ano
4.193
+0.254
6.44%
1 jan 1999 ano
4.405
+0.212
5.05%
1 jan 2000 ano
4.563
+0.159
3.6%
1 jan 2001 ano
4.829
+0.266
5.84%
1 jan 2002 ano
4.92
+0.09
1.87%
1 jan 2003 ano
4.915
-0.005
-0.1%
1 jan 2004 ano
4.55
-0.365
-7.43%
1 jan 2005 ano
4.459
-0.091
-2.0%
1 jan 2006 ano
4.486
+0.027
0.6%
1 jan 2007 ano
4.5
+0.014
0.32%
1 jan 2008 ano
4.375
-0.125
-2.79%
1 jan 2009 ano
4.296
-0.079
-1.81%
1 jan 2010 ano
4.473
+0.178
4.14%
1 jan 2011 ano
4.922
+0.448
10.03%
1 jan 2012 ano
5.038
+0.116
2.36%
1 jan 2013 ano
5.269
+0.231
4.59%
1 jan 2014 ano
5.208
-0.061
-1.16%
1 jan 2015 ano
5.191
-0.017
-0.33%
Classificação de países por estatísticas atuais por anos


Comentários: