29
/pt/
pt
AIzaSyAYiBZKx7MnpbEhh9jyipgxe19OcubqV5w
April 1, 2024
66295
Algeria
DZA
true
2
1
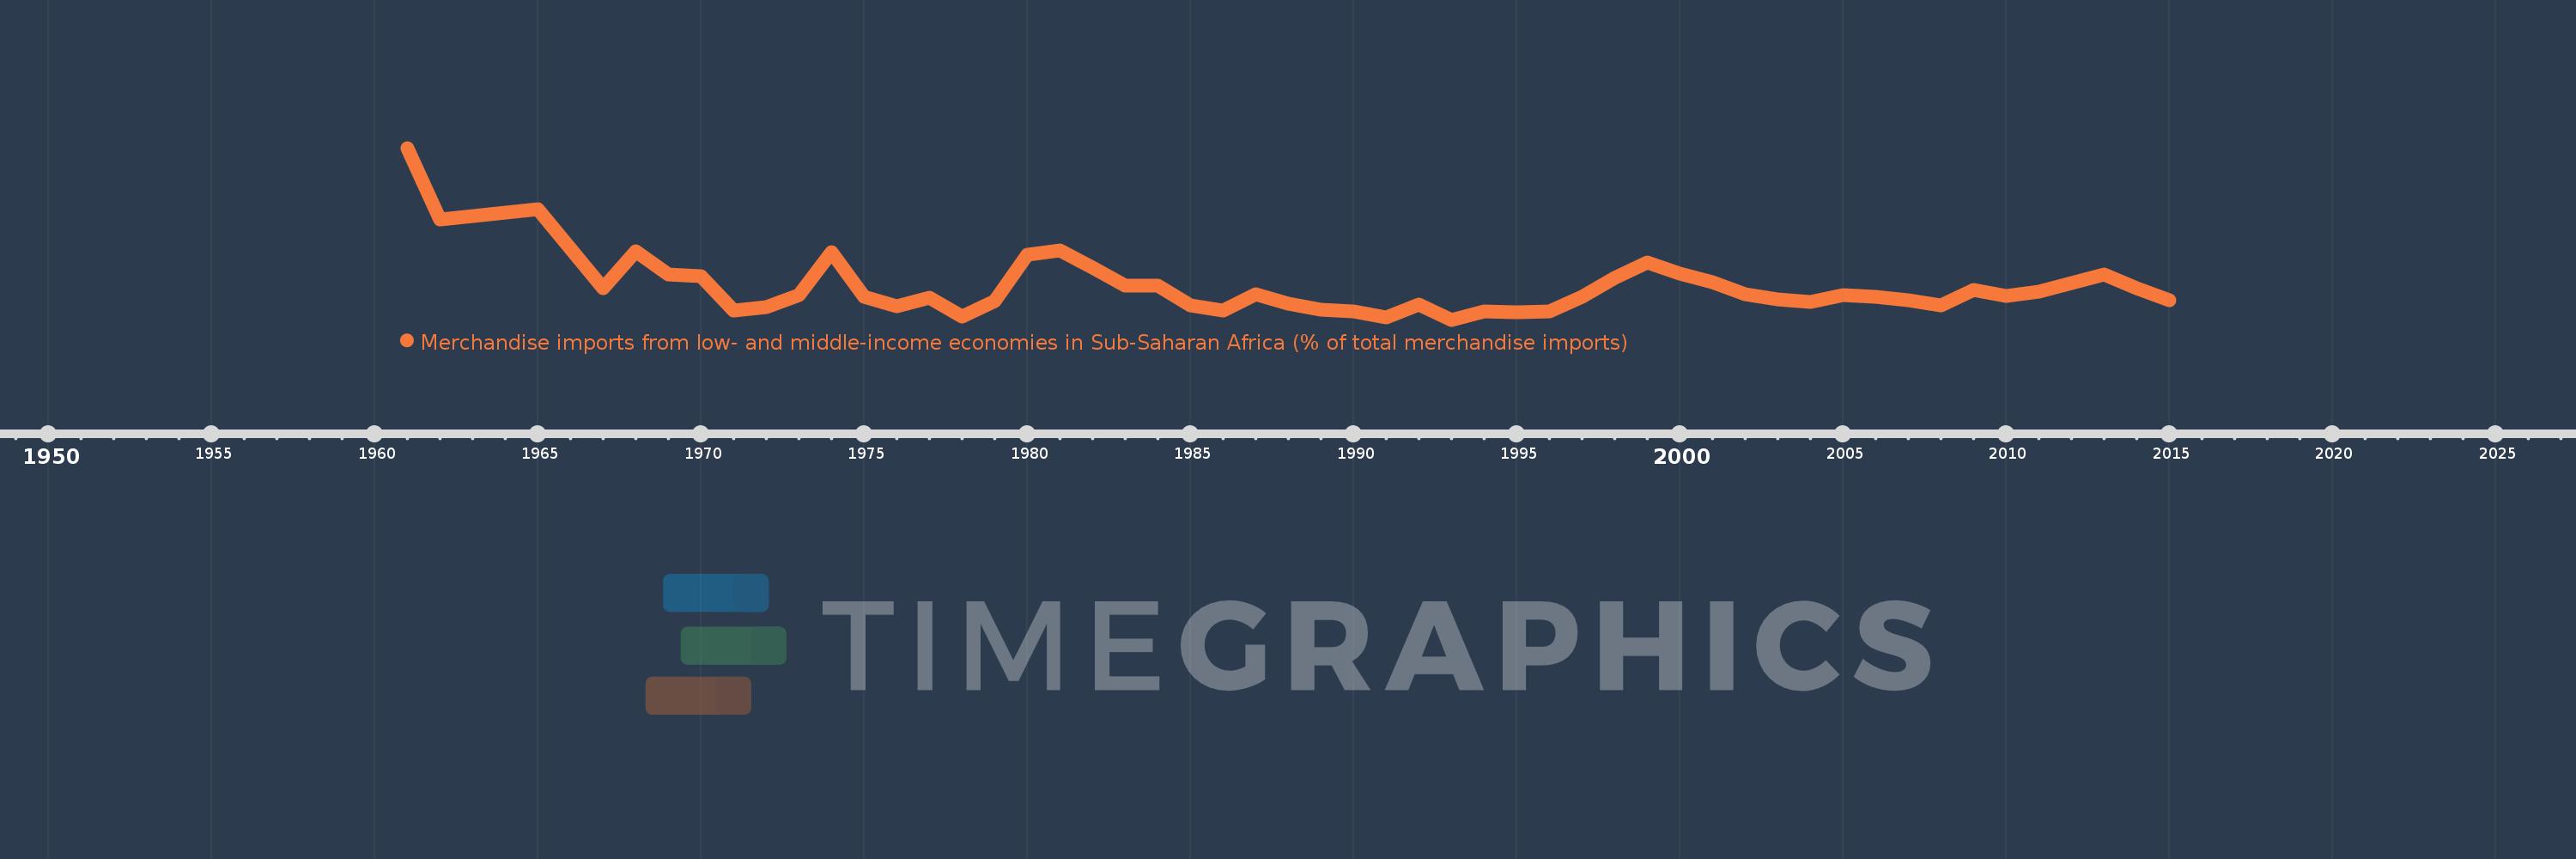
Merchandise imports from low- and middle-income economies in Sub-Saharan Africa (% of total merchandise imports)
2015,2014,2013,2012,2011,2010,2009,2008,2007,2006,2005,2004,2003,2002,2001,2000,1999,1998,1997,1996,1995,1994,1993,1992,1991,1990,1989,1988,1987,1986,1985,1984,1983,1982,1981,1980,1979,1978,1977,1976,1975,1974,1973,1972,1971,1970,1969,1968,1967,1965,1962,1961
Estas estatísticas em outros países:
AlbaniaAlgeriaAngolaArab WorldArgentinaArmeniaArubaAustraliaAustriaAzerbaijanBahamas, TheBahrainBangladeshBarbadosBelarusBelgiumBelizeBeninBermudaBoliviaBrazilBrunei DarussalamBulgariaBurkina FasoBurundiCabo VerdeCambodiaCameroonCanadaCaribbean small statesCentral African RepublicCentral Europe and the BalticsChadChileChinaColombiaCongo, Dem. Rep.Congo, Rep.Costa RicaCote d'IvoireCroatiaCubaCyprusCzech RepublicDenmarkDjiboutiDominicaDominican RepublicEarly-demographic dividendEast Asia & PacificEast Asia & Pacific (excluding high income)East Asia & Pacific (IDA & IBRD countries)EcuadorEgypt, Arab Rep.El SalvadorEstoniaEthiopiaEuro areaEurope & Central AsiaEurope & Central Asia (excluding high income)Europe & Central Asia (IDA & IBRD countries)European UnionFijiFinlandFragile and conflict affected situationsFranceGabonGambia, TheGeorgiaGermanyGhanaGreeceGreenlandGrenadaGuatemalaGuineaGuinea-BissauGuyanaHaitiHeavily indebted poor countries (HIPC)High incomeHondurasHong Kong SAR, ChinaHungaryIBRD onlyIcelandIDA & IBRD totalIDA blendIDA onlyIDA totalIndiaIndonesiaIran, Islamic Rep.IraqIrelandIsraelItalyJamaicaJapanJordanKazakhstanKenyaKorea, Dem. People’s Rep.Korea, Rep.KuwaitLao PDRLate-demographic dividendLatin America & Caribbean Latin America & Caribbean (excluding high income)Latin America & the Caribbean (IDA & IBRD countries)LatviaLeast developed countries: UN classificationLebanonLiberiaLibyaLithuaniaLow & middle incomeLow incomeLower middle incomeLuxembourgMacao SAR, ChinaMacedonia, FYRMadagascarMalawiMalaysiaMaliMaltaMauritaniaMauritiusMexicoMiddle East & North AfricaMiddle East & North Africa (excluding high income)Middle East & North Africa (IDA & IBRD countries)Middle incomeMoldovaMontenegroMoroccoMozambiqueMyanmarNetherlandsNew CaledoniaNew ZealandNicaraguaNigerNigeriaNorth AmericaNorwayOECD membersOmanOther small statesPacific island small statesPakistanPanamaPapua New GuineaParaguayPeruPhilippinesPolandPortugalPost-demographic dividendPre-demographic dividendQatarRomaniaRussian FederationRwandaSaudi ArabiaSenegalSerbiaSeychellesSierra LeoneSingaporeSlovak RepublicSloveniaSmall statesSomaliaSouth AfricaSouth AsiaSouth Asia (IDA & IBRD)SpainSri LankaSt. LuciaSt. Vincent and the GrenadinesSub-Saharan Africa Sub-Saharan Africa (excluding high income)Sub-Saharan Africa (IDA & IBRD countries)SudanSurinameSwedenSwitzerlandSyrian Arab RepublicTanzaniaThailandTogoTrinidad and TobagoTunisiaTurkeyUgandaUkraineUnited Arab EmiratesUnited KingdomUnited StatesUpper middle incomeUruguayVenezuela, RBVietnamWorldYemen, Rep.ZambiaZimbabwe Linha do tempo:
Nesta escala de tempo está apresentado um gráfico de 1961 ano até 2015 ano Algeria. Dados de 1960 ano ausente. O número de observações reais por data: 52.
Fonte (nome):
Indicadores de desenvolvimento mundial
Fonte (organização):
World Bank staff estimates based data from International Monetary Fund's Direction of Trade database.
Categorias:
Private Sector, Trade
Foi atualizado:
23 abr 2017 ano
Indicadores de alterações dos valores ao longo dos anos
Mínimo:
0.204
1 jan 1993 ano
Máximo:
5.032
1 jan 1961 ano
Na data de observação
Valor
Mudança absoluta
A alteração em relação ao valor anterior
1 jan 1961 ano
5.032
+5.032
0.0%
1 jan 1962 ano
3.018
-2.014
-40.02%
1 jan 1965 ano
3.31
+0.292
9.66%
1 jan 1967 ano
1.096
-2.213
-66.88%
1 jan 1968 ano
2.124
+1.028
93.8%
1 jan 1969 ano
1.486
-0.638
-30.03%
1 jan 1970 ano
1.438
-0.048
-3.25%
1 jan 1971 ano
0.451
-0.988
-68.67%
1 jan 1972 ano
0.547
+0.096
21.38%
1 jan 1973 ano
0.906
+0.359
65.7%
1 jan 1974 ano
2.113
+1.206
133.09%
1 jan 1975 ano
0.846
-1.266
-59.94%
1 jan 1976 ano
0.576
-0.271
-31.97%
1 jan 1977 ano
0.822
+0.246
42.77%
1 jan 1978 ano
0.304
-0.518
-63.02%
1 jan 1979 ano
0.735
+0.431
141.82%
1 jan 1980 ano
2.029
+1.294
176.0%
1 jan 1981 ano
2.16
+0.131
6.46%
1 jan 1982 ano
1.66
-0.5
-23.16%
1 jan 1983 ano
1.166
-0.493
-29.74%
1 jan 1984 ano
1.17
+0.004
0.34%
1 jan 1985 ano
0.604
-0.566
-48.39%
1 jan 1986 ano
0.461
-0.143
-23.6%
1 jan 1987 ano
0.92
+0.459
99.46%
1 jan 1988 ano
0.661
-0.259
-28.15%
1 jan 1989 ano
0.48
-0.181
-27.37%
1 jan 1990 ano
0.438
-0.043
-8.88%
1 jan 1991 ano
0.259
-0.179
-40.91%
1 jan 1992 ano
0.625
+0.367
141.8%
1 jan 1993 ano
0.204
-0.422
-67.43%
1 jan 1994 ano
0.446
+0.243
119.22%
1 jan 1995 ano
0.403
-0.043
-9.63%
1 jan 1996 ano
0.441
+0.038
9.33%
1 jan 1997 ano
0.847
+0.405
91.92%
1 jan 1998 ano
1.385
+0.538
63.59%
1 jan 1999 ano
1.805
+0.42
30.35%
1 jan 2000 ano
1.503
-0.302
-16.76%
1 jan 2001 ano
1.258
-0.244
-16.26%
1 jan 2002 ano
0.914
-0.345
-27.41%
1 jan 2003 ano
0.779
-0.134
-14.69%
1 jan 2004 ano
0.7
-0.079
-10.17%
1 jan 2005 ano
0.9
+0.199
28.49%
1 jan 2006 ano
0.848
-0.051
-5.71%
1 jan 2007 ano
0.759
-0.089
-10.54%
1 jan 2008 ano
0.616
-0.142
-18.76%
1 jan 2009 ano
1.044
+0.428
69.37%
1 jan 2010 ano
0.861
-0.183
-17.5%
1 jan 2011 ano
0.982
+0.121
14.05%
1 jan 2012 ano
1.227
+0.244
24.88%
1 jan 2013 ano
1.472
+0.245
19.98%
1 jan 2014 ano
1.085
-0.387
-26.28%
1 jan 2015 ano
0.759
-0.326
-30.02%
Classificação de países por estatísticas atuais por anos


Comentários: