29
/pt/
pt
AIzaSyAYiBZKx7MnpbEhh9jyipgxe19OcubqV5w
April 1, 2024
158669
Iraq
IRQ
true
2
1
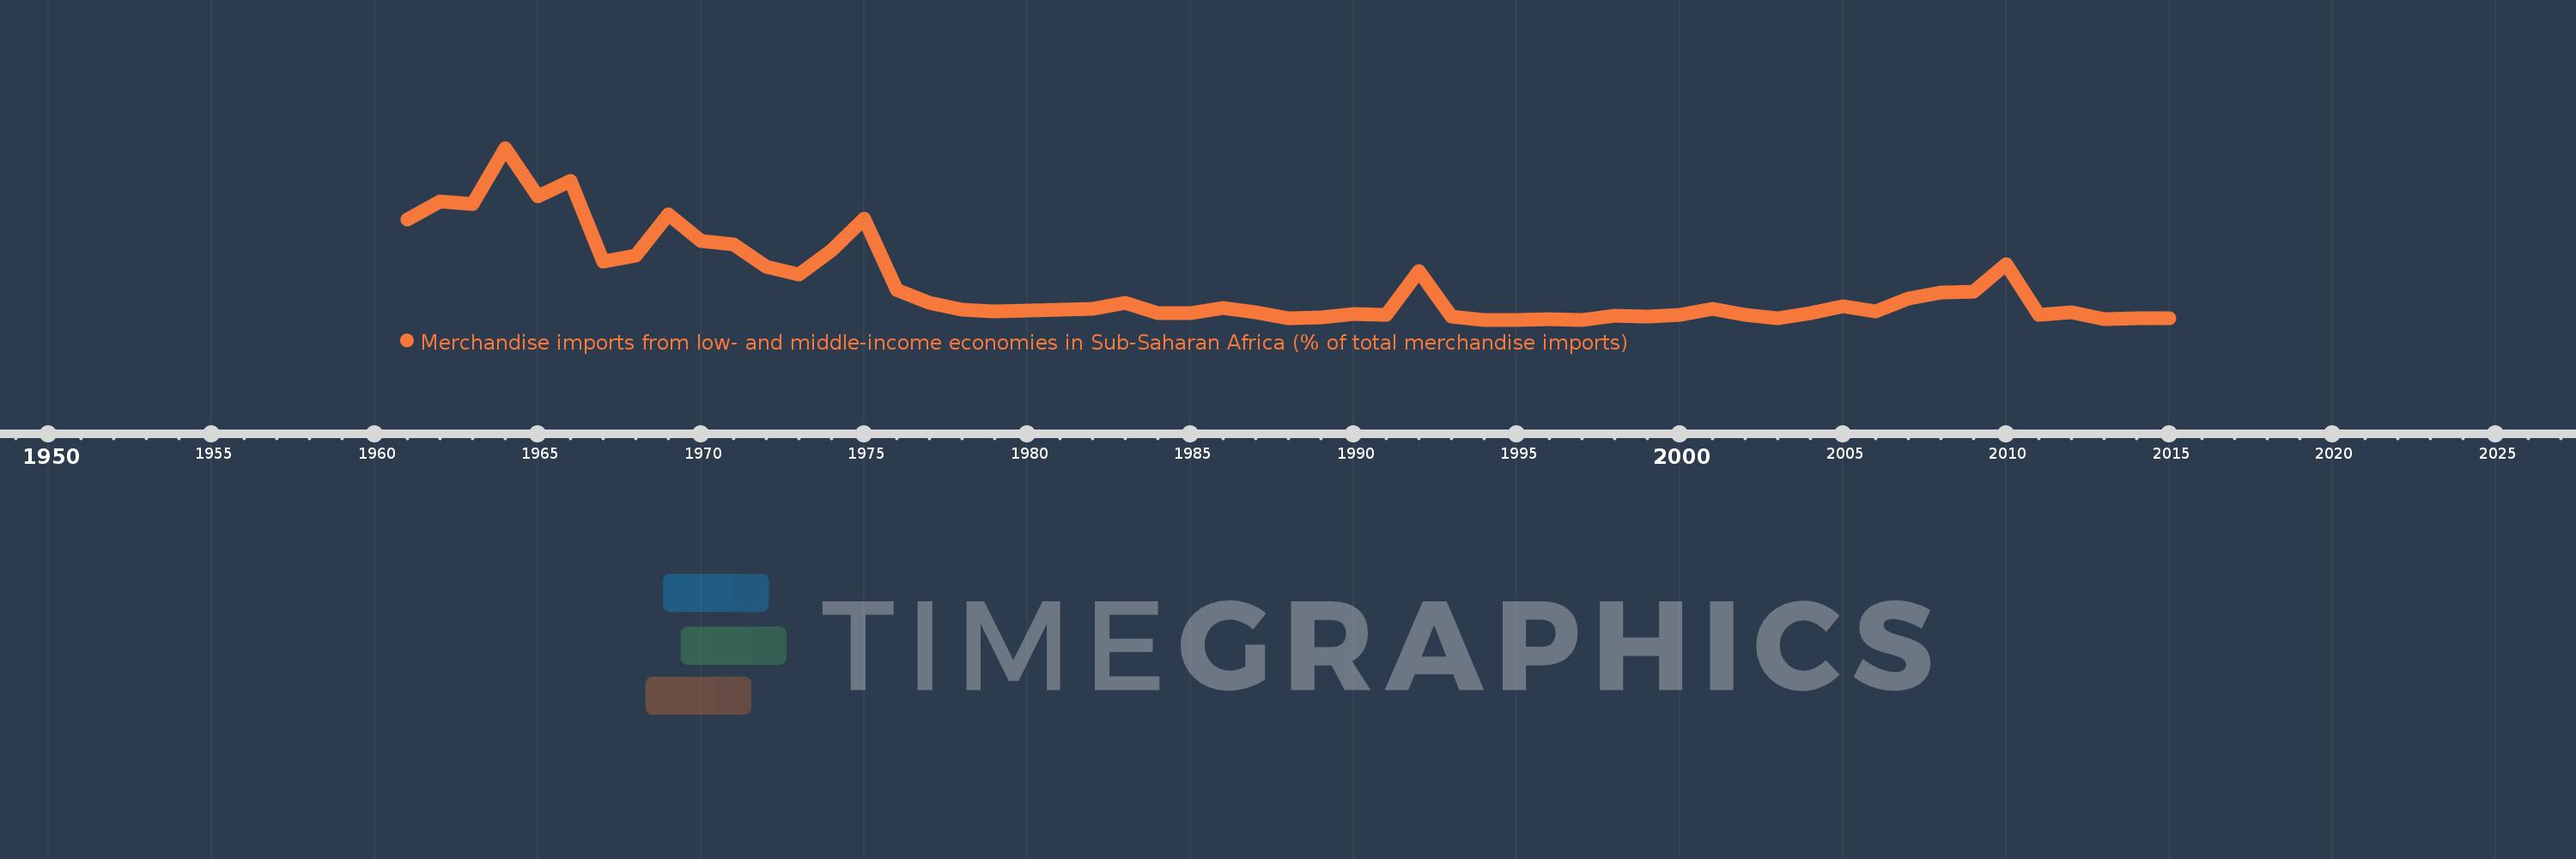
Merchandise imports from low- and middle-income economies in Sub-Saharan Africa (% of total merchandise imports)
2015,2014,2013,2012,2011,2010,2009,2008,2007,2006,2005,2004,2003,2002,2001,2000,1999,1998,1997,1996,1995,1994,1993,1992,1991,1990,1989,1988,1987,1986,1985,1984,1983,1982,1979,1978,1977,1976,1975,1974,1973,1972,1971,1970,1969,1968,1967,1966,1965,1964,1963,1962,1961
Estas estatísticas em outros países:
AlbaniaAlgeriaAngolaArab WorldArgentinaArmeniaArubaAustraliaAustriaAzerbaijanBahamas, TheBahrainBangladeshBarbadosBelarusBelgiumBelizeBeninBermudaBoliviaBrazilBrunei DarussalamBulgariaBurkina FasoBurundiCabo VerdeCambodiaCameroonCanadaCaribbean small statesCentral African RepublicCentral Europe and the BalticsChadChileChinaColombiaCongo, Dem. Rep.Congo, Rep.Costa RicaCote d'IvoireCroatiaCubaCyprusCzech RepublicDenmarkDjiboutiDominicaDominican RepublicEarly-demographic dividendEast Asia & PacificEast Asia & Pacific (excluding high income)East Asia & Pacific (IDA & IBRD countries)EcuadorEgypt, Arab Rep.El SalvadorEstoniaEthiopiaEuro areaEurope & Central AsiaEurope & Central Asia (excluding high income)Europe & Central Asia (IDA & IBRD countries)European UnionFijiFinlandFragile and conflict affected situationsFranceGabonGambia, TheGeorgiaGermanyGhanaGreeceGreenlandGrenadaGuatemalaGuineaGuinea-BissauGuyanaHaitiHeavily indebted poor countries (HIPC)High incomeHondurasHong Kong SAR, ChinaHungaryIBRD onlyIcelandIDA & IBRD totalIDA blendIDA onlyIDA totalIndiaIndonesiaIran, Islamic Rep.IraqIrelandIsraelItalyJamaicaJapanJordanKazakhstanKenyaKorea, Dem. People’s Rep.Korea, Rep.KuwaitLao PDRLate-demographic dividendLatin America & Caribbean Latin America & Caribbean (excluding high income)Latin America & the Caribbean (IDA & IBRD countries)LatviaLeast developed countries: UN classificationLebanonLiberiaLibyaLithuaniaLow & middle incomeLow incomeLower middle incomeLuxembourgMacao SAR, ChinaMacedonia, FYRMadagascarMalawiMalaysiaMaliMaltaMauritaniaMauritiusMexicoMiddle East & North AfricaMiddle East & North Africa (excluding high income)Middle East & North Africa (IDA & IBRD countries)Middle incomeMoldovaMontenegroMoroccoMozambiqueMyanmarNetherlandsNew CaledoniaNew ZealandNicaraguaNigerNigeriaNorth AmericaNorwayOECD membersOmanOther small statesPacific island small statesPakistanPanamaPapua New GuineaParaguayPeruPhilippinesPolandPortugalPost-demographic dividendPre-demographic dividendQatarRomaniaRussian FederationRwandaSaudi ArabiaSenegalSerbiaSeychellesSierra LeoneSingaporeSlovak RepublicSloveniaSmall statesSomaliaSouth AfricaSouth AsiaSouth Asia (IDA & IBRD)SpainSri LankaSt. LuciaSt. Vincent and the GrenadinesSub-Saharan Africa Sub-Saharan Africa (excluding high income)Sub-Saharan Africa (IDA & IBRD countries)SudanSurinameSwedenSwitzerlandSyrian Arab RepublicTanzaniaThailandTogoTrinidad and TobagoTunisiaTurkeyUgandaUkraineUnited Arab EmiratesUnited KingdomUnited StatesUpper middle incomeUruguayVenezuela, RBVietnamWorldYemen, Rep.ZambiaZimbabwe Linha do tempo:
Nesta escala de tempo está apresentado um gráfico de 1961 ano até 2015 ano Iraq. Dados de 1960 ano ausente. O número de observações reais por data: 53.
Fonte (nome):
Indicadores de desenvolvimento mundial
Fonte (organização):
World Bank staff estimates based data from International Monetary Fund's Direction of Trade database.
Categorias:
Private Sector, Trade
Foi atualizado:
23 abr 2017 ano
Indicadores de alterações dos valores ao longo dos anos
Máximo:
2.213
1 jan 1964 ano
Na data de observação
Valor
Mudança absoluta
A alteração em relação ao valor anterior
1 jan 1961 ano
1.292
+1.292
0.0%
1 jan 1962 ano
1.519
+0.227
17.54%
1 jan 1963 ano
1.488
-0.03
-1.99%
1 jan 1964 ano
2.213
+0.725
48.69%
1 jan 1965 ano
1.588
-0.624
-28.22%
1 jan 1966 ano
1.791
+0.202
12.73%
1 jan 1967 ano
0.753
-1.038
-57.96%
1 jan 1968 ano
0.827
+0.074
9.86%
1 jan 1969 ano
1.354
+0.527
63.71%
1 jan 1970 ano
1.016
-0.338
-24.97%
1 jan 1971 ano
0.97
-0.046
-4.49%
1 jan 1972 ano
0.685
-0.285
-29.37%
1 jan 1973 ano
0.586
-0.1
-14.56%
1 jan 1974 ano
0.895
+0.309
52.77%
1 jan 1975 ano
1.298
+0.404
45.14%
1 jan 1976 ano
0.385
-0.913
-70.31%
1 jan 1977 ano
0.223
-0.162
-42.12%
1 jan 1978 ano
0.127
-0.096
-42.98%
1 jan 1979 ano
0.107
-0.02
-16.03%
1 jan 1982 ano
0.14
+0.033
30.67%
1 jan 1983 ano
0.213
+0.073
52.26%
1 jan 1984 ano
0.08
-0.133
-62.47%
1 jan 1985 ano
0.083
+0.003
4.21%
1 jan 1986 ano
0.15
+0.067
80.8%
1 jan 1987 ano
0.1
-0.05
-33.41%
1 jan 1988 ano
0.022
-0.078
-77.83%
1 jan 1989 ano
0.034
+0.012
53.96%
1 jan 1990 ano
0.078
+0.044
128.49%
1 jan 1991 ano
0.061
-0.017
-22.13%
1 jan 1992 ano
0.632
+0.571
940.08%
1 jan 1993 ano
0.036
-0.596
-94.27%
1 jan 1994 ano
0.0
-0.036
-100.0%
1 jan 1996 ano
0.006
+0.006
7.49 mil%
1 jan 1997 ano
0.001
-0.004
-76.61%
1 jan 1998 ano
0.048
+0.047
3.47 mil%
1 jan 1999 ano
0.042
-0.006
-12.22%
1 jan 2000 ano
0.066
+0.024
56.61%
1 jan 2001 ano
0.144
+0.079
119.31%
1 jan 2002 ano
0.063
-0.082
-56.65%
1 jan 2003 ano
0.023
-0.039
-62.56%
1 jan 2004 ano
0.089
+0.066
281.79%
1 jan 2005 ano
0.174
+0.085
94.74%
1 jan 2006 ano
0.105
-0.069
-39.77%
1 jan 2007 ano
0.268
+0.163
155.06%
1 jan 2008 ano
0.354
+0.087
32.34%
1 jan 2009 ano
0.363
+0.008
2.37%
1 jan 2010 ano
0.719
+0.356
98.21%
1 jan 2011 ano
0.061
-0.658
-91.54%
1 jan 2012 ano
0.101
+0.04
66.21%
1 jan 2013 ano
0.013
-0.088
-87.33%
1 jan 2014 ano
0.016
+0.003
22.53%
1 jan 2015 ano
0.016
+0.001
4.23%
Classificação de países por estatísticas atuais por anos


Comentários: