29
/pt/
pt
AIzaSyAYiBZKx7MnpbEhh9jyipgxe19OcubqV5w
April 1, 2024
275949
United Kingdom
GBR
true
2
1
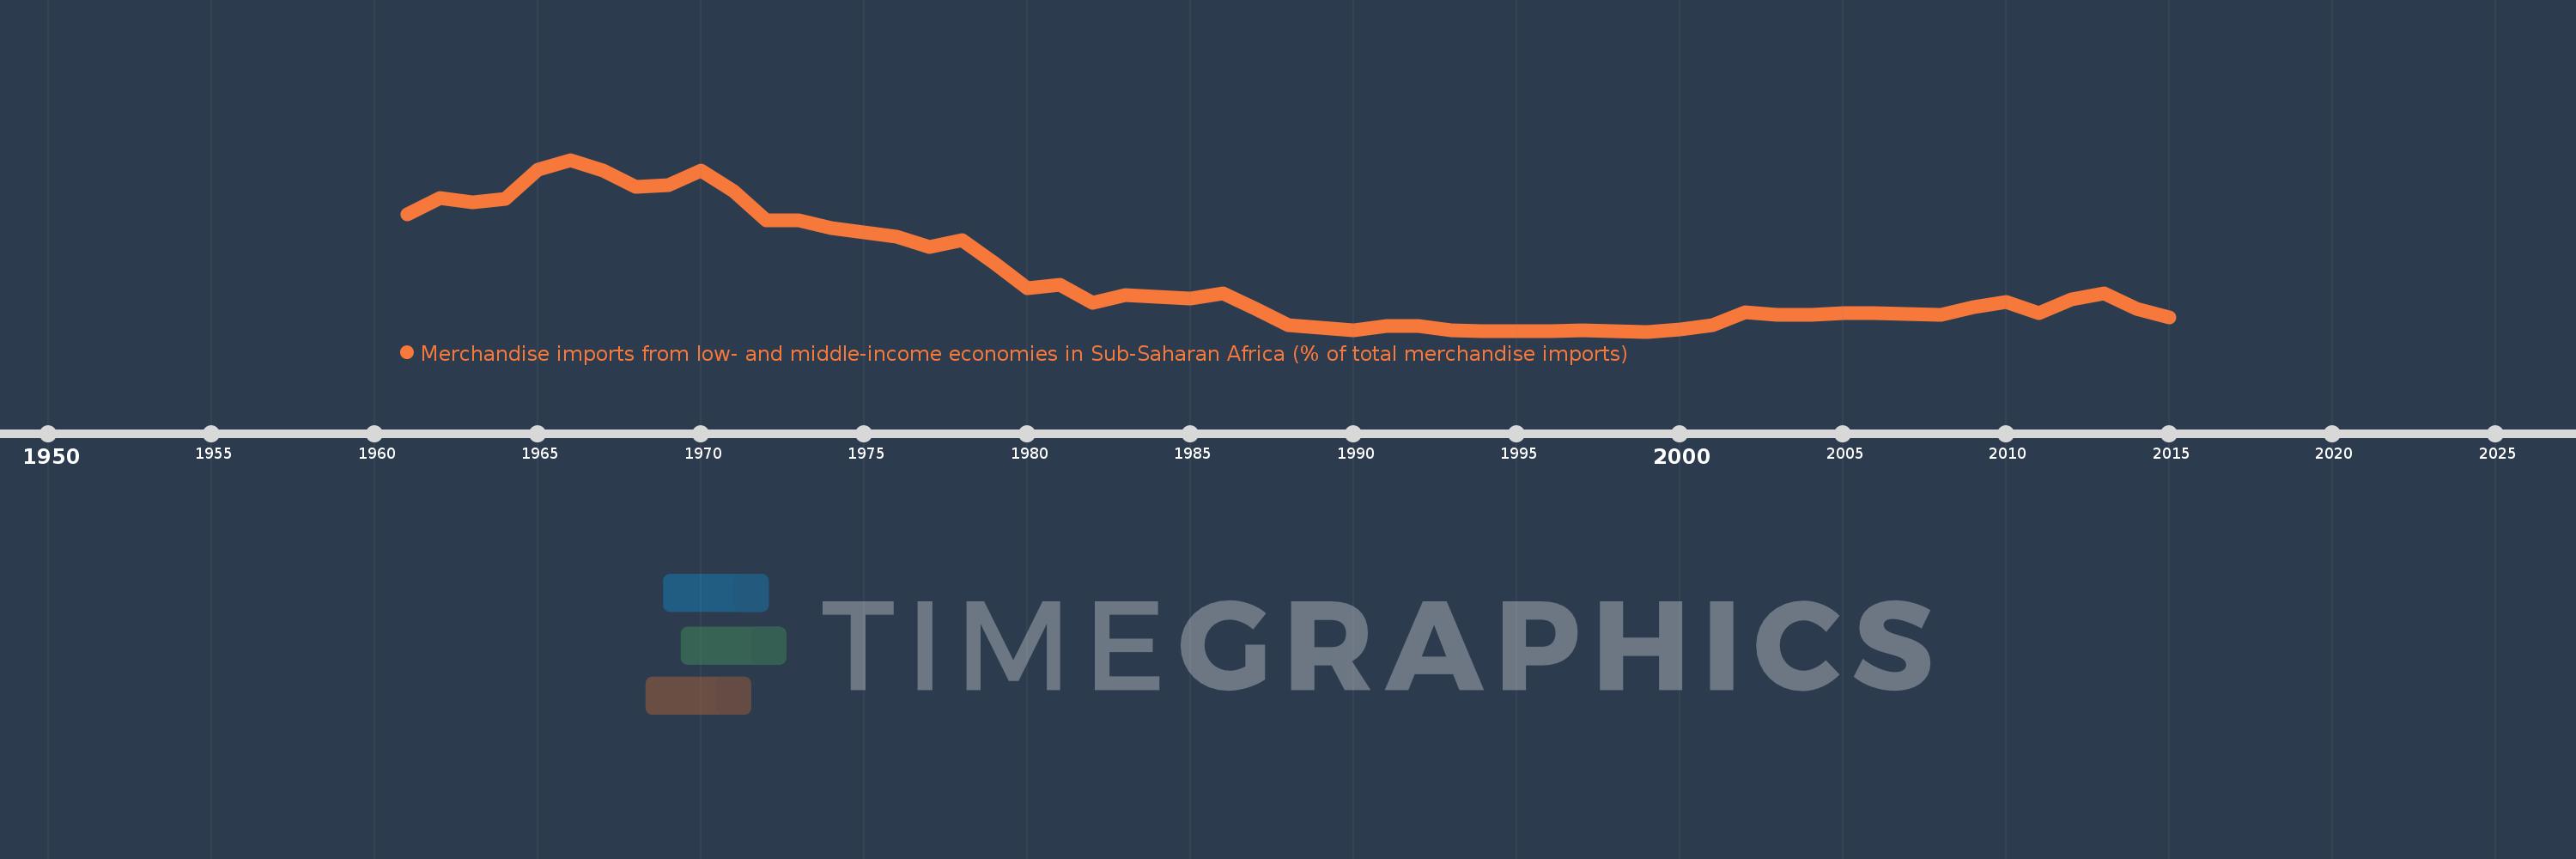
Merchandise imports from low- and middle-income economies in Sub-Saharan Africa (% of total merchandise imports)
2015,2014,2013,2012,2011,2010,2009,2008,2007,2006,2005,2004,2003,2002,2001,2000,1999,1998,1997,1996,1995,1994,1993,1992,1991,1990,1989,1988,1987,1986,1985,1984,1983,1982,1981,1980,1979,1978,1977,1976,1975,1974,1973,1972,1971,1970,1969,1968,1967,1966,1965,1964,1963,1962,1961
Estas estatísticas em outros países:
AlbaniaAlgeriaAngolaArab WorldArgentinaArmeniaArubaAustraliaAustriaAzerbaijanBahamas, TheBahrainBangladeshBarbadosBelarusBelgiumBelizeBeninBermudaBoliviaBrazilBrunei DarussalamBulgariaBurkina FasoBurundiCabo VerdeCambodiaCameroonCanadaCaribbean small statesCentral African RepublicCentral Europe and the BalticsChadChileChinaColombiaCongo, Dem. Rep.Congo, Rep.Costa RicaCote d'IvoireCroatiaCubaCyprusCzech RepublicDenmarkDjiboutiDominicaDominican RepublicEarly-demographic dividendEast Asia & PacificEast Asia & Pacific (excluding high income)East Asia & Pacific (IDA & IBRD countries)EcuadorEgypt, Arab Rep.El SalvadorEstoniaEthiopiaEuro areaEurope & Central AsiaEurope & Central Asia (excluding high income)Europe & Central Asia (IDA & IBRD countries)European UnionFijiFinlandFragile and conflict affected situationsFranceGabonGambia, TheGeorgiaGermanyGhanaGreeceGreenlandGrenadaGuatemalaGuineaGuinea-BissauGuyanaHaitiHeavily indebted poor countries (HIPC)High incomeHondurasHong Kong SAR, ChinaHungaryIBRD onlyIcelandIDA & IBRD totalIDA blendIDA onlyIDA totalIndiaIndonesiaIran, Islamic Rep.IraqIrelandIsraelItalyJamaicaJapanJordanKazakhstanKenyaKorea, Dem. People’s Rep.Korea, Rep.KuwaitLao PDRLate-demographic dividendLatin America & Caribbean Latin America & Caribbean (excluding high income)Latin America & the Caribbean (IDA & IBRD countries)LatviaLeast developed countries: UN classificationLebanonLiberiaLibyaLithuaniaLow & middle incomeLow incomeLower middle incomeLuxembourgMacao SAR, ChinaMacedonia, FYRMadagascarMalawiMalaysiaMaliMaltaMauritaniaMauritiusMexicoMiddle East & North AfricaMiddle East & North Africa (excluding high income)Middle East & North Africa (IDA & IBRD countries)Middle incomeMoldovaMontenegroMoroccoMozambiqueMyanmarNetherlandsNew CaledoniaNew ZealandNicaraguaNigerNigeriaNorth AmericaNorwayOECD membersOmanOther small statesPacific island small statesPakistanPanamaPapua New GuineaParaguayPeruPhilippinesPolandPortugalPost-demographic dividendPre-demographic dividendQatarRomaniaRussian FederationRwandaSaudi ArabiaSenegalSerbiaSeychellesSierra LeoneSingaporeSlovak RepublicSloveniaSmall statesSomaliaSouth AfricaSouth AsiaSouth Asia (IDA & IBRD)SpainSri LankaSt. LuciaSt. Vincent and the GrenadinesSub-Saharan Africa Sub-Saharan Africa (excluding high income)Sub-Saharan Africa (IDA & IBRD countries)SudanSurinameSwedenSwitzerlandSyrian Arab RepublicTanzaniaThailandTogoTrinidad and TobagoTunisiaTurkeyUgandaUkraineUnited Arab EmiratesUnited KingdomUnited StatesUpper middle incomeUruguayVenezuela, RBVietnamWorldYemen, Rep.ZambiaZimbabwe Linha do tempo:
Nesta escala de tempo está apresentado um gráfico de 1961 ano até 2015 ano United Kingdom. Dados de 1960 ano ausente. O número de observações reais por data: 55.
Fonte (nome):
Indicadores de desenvolvimento mundial
Fonte (organização):
World Bank staff estimates based data from International Monetary Fund's Direction of Trade database.
Categorias:
Private Sector, Trade
Foi atualizado:
23 abr 2017 ano
Indicadores de alterações dos valores ao longo dos anos
Mínimo:
1.523
1 jan 1999 ano
Máximo:
10.297
1 jan 1966 ano
Na data de observação
Valor
Mudança absoluta
A alteração em relação ao valor anterior
1 jan 1961 ano
7.495
+7.495
0.0%
1 jan 1962 ano
8.338
+0.844
11.26%
1 jan 1963 ano
8.105
-0.234
-2.81%
1 jan 1964 ano
8.304
+0.199
2.46%
1 jan 1965 ano
9.811
+1.507
18.15%
1 jan 1966 ano
10.297
+0.486
4.96%
1 jan 1967 ano
9.759
-0.538
-5.23%
1 jan 1968 ano
8.921
-0.838
-8.58%
1 jan 1969 ano
9.017
+0.096
1.08%
1 jan 1970 ano
9.748
+0.731
8.11%
1 jan 1971 ano
8.716
-1.033
-10.59%
1 jan 1972 ano
7.221
-1.495
-17.15%
1 jan 1973 ano
7.212
-0.008
-0.11%
1 jan 1974 ano
6.823
-0.39
-5.41%
1 jan 1975 ano
6.584
-0.238
-3.49%
1 jan 1976 ano
6.37
-0.215
-3.26%
1 jan 1977 ano
5.852
-0.517
-8.12%
1 jan 1978 ano
6.198
+0.345
5.9%
1 jan 1979 ano
5.011
-1.187
-19.15%
1 jan 1980 ano
3.743
-1.267
-25.29%
1 jan 1981 ano
3.918
+0.175
4.67%
1 jan 1982 ano
3.005
-0.913
-23.31%
1 jan 1983 ano
3.369
+0.364
12.12%
1 jan 1984 ano
3.311
-0.058
-1.73%
1 jan 1985 ano
3.22
-0.091
-2.75%
1 jan 1986 ano
3.486
+0.266
8.27%
1 jan 1987 ano
2.677
-0.809
-23.2%
1 jan 1988 ano
1.865
-0.812
-30.34%
1 jan 1989 ano
1.727
-0.138
-7.39%
1 jan 1990 ano
1.575
-0.152
-8.8%
1 jan 1991 ano
1.819
+0.243
15.46%
1 jan 1992 ano
1.823
+0.005
0.25%
1 jan 1993 ano
1.587
-0.236
-12.92%
1 jan 1994 ano
1.557
-0.03
-1.89%
1 jan 1995 ano
1.527
-0.031
-1.98%
1 jan 1996 ano
1.548
+0.021
1.38%
1 jan 1997 ano
1.586
+0.038
2.47%
1 jan 1998 ano
1.54
-0.046
-2.93%
1 jan 1999 ano
1.523
-0.017
-1.1%
1 jan 2000 ano
1.623
+0.101
6.6%
1 jan 2001 ano
1.861
+0.238
14.67%
1 jan 2002 ano
2.505
+0.644
34.6%
1 jan 2003 ano
2.382
-0.123
-4.92%
1 jan 2004 ano
2.357
-0.025
-1.06%
1 jan 2005 ano
2.47
+0.113
4.8%
1 jan 2006 ano
2.483
+0.014
0.55%
1 jan 2007 ano
2.444
-0.039
-1.59%
1 jan 2008 ano
2.371
-0.073
-2.99%
1 jan 2009 ano
2.774
+0.403
17.01%
1 jan 2010 ano
3.015
+0.241
8.69%
1 jan 2011 ano
2.449
-0.566
-18.78%
1 jan 2012 ano
3.166
+0.717
29.29%
1 jan 2013 ano
3.485
+0.319
10.07%
1 jan 2014 ano
2.675
-0.809
-23.22%
1 jan 2015 ano
2.251
-0.424
-15.86%
Classificação de países por estatísticas atuais por anos


Comentários: