29
/pt/
pt
AIzaSyAYiBZKx7MnpbEhh9jyipgxe19OcubqV5w
April 1, 2024
31832
Europe & Central Asia (excluding high income)
ECA
false
2
1
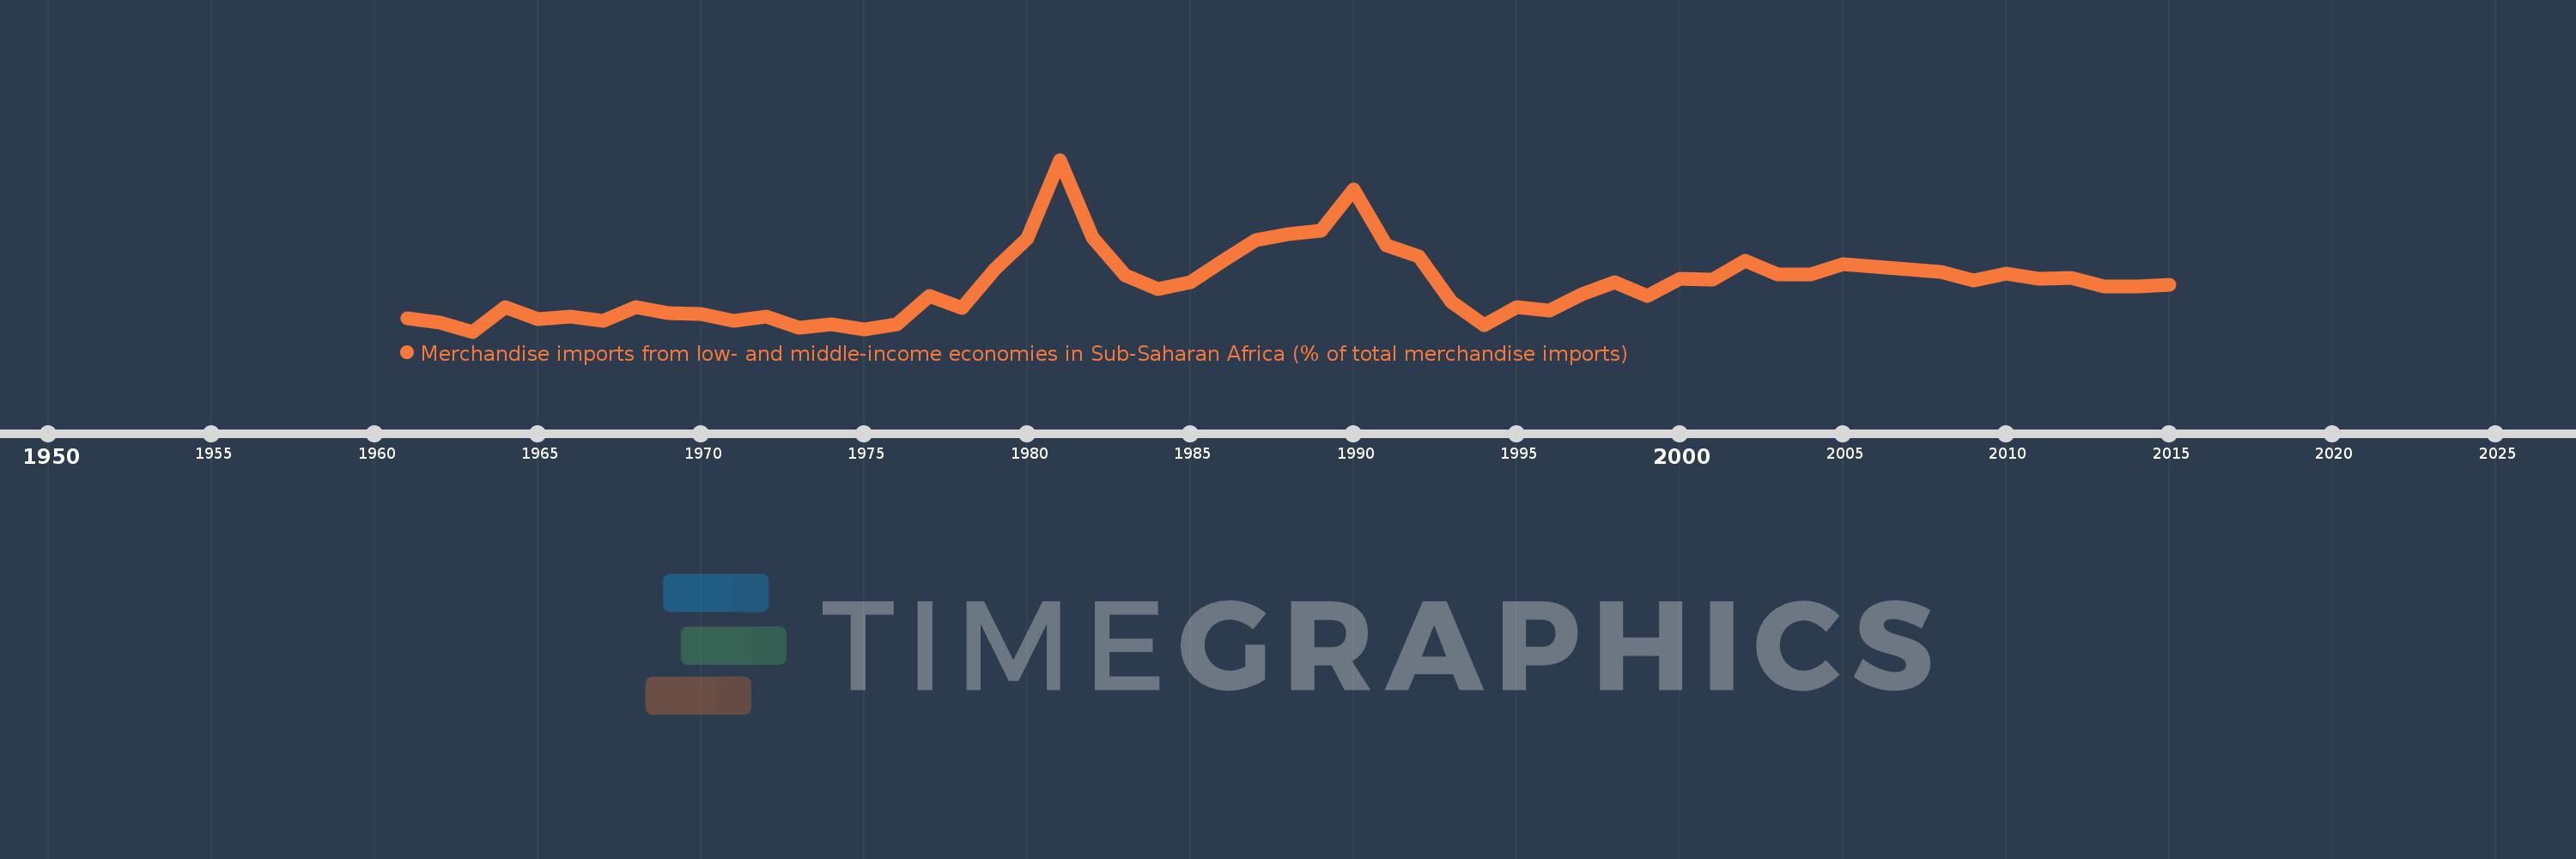
Merchandise imports from low- and middle-income economies in Sub-Saharan Africa (% of total merchandise imports)
2015,2014,2013,2012,2011,2010,2009,2008,2007,2006,2005,2004,2003,2002,2001,2000,1999,1998,1997,1996,1995,1994,1993,1992,1991,1990,1989,1988,1987,1986,1985,1984,1983,1982,1981,1980,1979,1978,1977,1976,1975,1974,1973,1972,1971,1970,1969,1968,1967,1966,1965,1964,1963,1962,1961
Estas estatísticas em outros países:
AlbaniaAlgeriaAngolaArab WorldArgentinaArmeniaArubaAustraliaAustriaAzerbaijanBahamas, TheBahrainBangladeshBarbadosBelarusBelgiumBelizeBeninBermudaBoliviaBrazilBrunei DarussalamBulgariaBurkina FasoBurundiCabo VerdeCambodiaCameroonCanadaCaribbean small statesCentral African RepublicCentral Europe and the BalticsChadChileChinaColombiaCongo, Dem. Rep.Congo, Rep.Costa RicaCote d'IvoireCroatiaCubaCyprusCzech RepublicDenmarkDjiboutiDominicaDominican RepublicEarly-demographic dividendEast Asia & PacificEast Asia & Pacific (excluding high income)East Asia & Pacific (IDA & IBRD countries)EcuadorEgypt, Arab Rep.El SalvadorEstoniaEthiopiaEuro areaEurope & Central AsiaEurope & Central Asia (excluding high income)Europe & Central Asia (IDA & IBRD countries)European UnionFijiFinlandFragile and conflict affected situationsFranceGabonGambia, TheGeorgiaGermanyGhanaGreeceGreenlandGrenadaGuatemalaGuineaGuinea-BissauGuyanaHaitiHeavily indebted poor countries (HIPC)High incomeHondurasHong Kong SAR, ChinaHungaryIBRD onlyIcelandIDA & IBRD totalIDA blendIDA onlyIDA totalIndiaIndonesiaIran, Islamic Rep.IraqIrelandIsraelItalyJamaicaJapanJordanKazakhstanKenyaKorea, Dem. People’s Rep.Korea, Rep.KuwaitLao PDRLate-demographic dividendLatin America & Caribbean Latin America & Caribbean (excluding high income)Latin America & the Caribbean (IDA & IBRD countries)LatviaLeast developed countries: UN classificationLebanonLiberiaLibyaLithuaniaLow & middle incomeLow incomeLower middle incomeLuxembourgMacao SAR, ChinaMacedonia, FYRMadagascarMalawiMalaysiaMaliMaltaMauritaniaMauritiusMexicoMiddle East & North AfricaMiddle East & North Africa (excluding high income)Middle East & North Africa (IDA & IBRD countries)Middle incomeMoldovaMontenegroMoroccoMozambiqueMyanmarNetherlandsNew CaledoniaNew ZealandNicaraguaNigerNigeriaNorth AmericaNorwayOECD membersOmanOther small statesPacific island small statesPakistanPanamaPapua New GuineaParaguayPeruPhilippinesPolandPortugalPost-demographic dividendPre-demographic dividendQatarRomaniaRussian FederationRwandaSaudi ArabiaSenegalSerbiaSeychellesSierra LeoneSingaporeSlovak RepublicSloveniaSmall statesSomaliaSouth AfricaSouth AsiaSouth Asia (IDA & IBRD)SpainSri LankaSt. LuciaSt. Vincent and the GrenadinesSub-Saharan Africa Sub-Saharan Africa (excluding high income)Sub-Saharan Africa (IDA & IBRD countries)SudanSurinameSwedenSwitzerlandSyrian Arab RepublicTanzaniaThailandTogoTrinidad and TobagoTunisiaTurkeyUgandaUkraineUnited Arab EmiratesUnited KingdomUnited StatesUpper middle incomeUruguayVenezuela, RBVietnamWorldYemen, Rep.ZambiaZimbabwe Linha do tempo:
Nesta escala de tempo está apresentado um gráfico de 1961 ano até 2015 ano Europe & Central Asia (excluding high income). Dados de 1960 ano ausente. O número de observações reais por data: 55.
Fonte (nome):
Indicadores de desenvolvimento mundial
Fonte (organização):
World Bank staff estimates based data from International Monetary Fund's Direction of Trade database.
Categorias:
Private Sector, Trade
Foi atualizado:
23 abr 2017 ano
Indicadores de alterações dos valores ao longo dos anos
Mínimo:
0.03
1 jan 1963 ano
Máximo:
2.194
1 jan 1981 ano
Na data de observação
Valor
Mudança absoluta
A alteração em relação ao valor anterior
1 jan 1961 ano
0.193
+0.193
0.0%
1 jan 1962 ano
0.145
-0.048
-24.78%
1 jan 1963 ano
0.03
-0.115
-79.19%
1 jan 1964 ano
0.337
+0.306
1.01 mil%
1 jan 1965 ano
0.183
-0.154
-45.62%
1 jan 1966 ano
0.217
+0.034
18.65%
1 jan 1967 ano
0.162
-0.055
-25.33%
1 jan 1968 ano
0.339
+0.177
109.04%
1 jan 1969 ano
0.258
-0.081
-23.85%
1 jan 1970 ano
0.256
-0.002
-0.69%
1 jan 1971 ano
0.166
-0.091
-35.46%
1 jan 1972 ano
0.219
+0.053
32.24%
1 jan 1973 ano
0.075
-0.144
-65.63%
1 jan 1974 ano
0.12
+0.044
59.07%
1 jan 1975 ano
0.062
-0.057
-47.9%
1 jan 1976 ano
0.118
+0.056
89.4%
1 jan 1977 ano
0.474
+0.356
301.8%
1 jan 1978 ano
0.325
-0.15
-31.56%
1 jan 1979 ano
0.814
+0.489
150.54%
1 jan 1980 ano
1.203
+0.389
47.83%
1 jan 1981 ano
2.194
+0.992
82.45%
1 jan 1982 ano
1.217
-0.978
-44.56%
1 jan 1983 ano
0.744
-0.472
-38.82%
1 jan 1984 ano
0.561
-0.183
-24.6%
1 jan 1985 ano
0.656
+0.095
16.93%
1 jan 1986 ano
0.918
+0.261
39.83%
1 jan 1987 ano
1.18
+0.262
28.56%
1 jan 1988 ano
1.257
+0.077
6.56%
1 jan 1989 ano
1.296
+0.039
3.1%
1 jan 1990 ano
1.818
+0.522
40.28%
1 jan 1991 ano
1.122
-0.696
-38.3%
1 jan 1992 ano
0.972
-0.15
-13.38%
1 jan 1993 ano
0.401
-0.57
-58.72%
1 jan 1994 ano
0.115
-0.286
-71.29%
1 jan 1995 ano
0.341
+0.226
195.86%
1 jan 1996 ano
0.3
-0.041
-11.93%
1 jan 1997 ano
0.504
+0.204
68.02%
1 jan 1998 ano
0.648
+0.144
28.56%
1 jan 1999 ano
0.478
-0.17
-26.23%
1 jan 2000 ano
0.699
+0.221
46.29%
1 jan 2001 ano
0.684
-0.016
-2.24%
1 jan 2002 ano
0.922
+0.238
34.87%
1 jan 2003 ano
0.747
-0.175
-18.98%
1 jan 2004 ano
0.752
+0.005
0.7%
1 jan 2005 ano
0.882
+0.129
17.19%
1 jan 2006 ano
0.848
-0.033
-3.79%
1 jan 2007 ano
0.814
-0.034
-3.98%
1 jan 2008 ano
0.781
-0.033
-4.05%
1 jan 2009 ano
0.676
-0.106
-13.53%
1 jan 2010 ano
0.758
+0.082
12.15%
1 jan 2011 ano
0.697
-0.061
-8.06%
1 jan 2012 ano
0.711
+0.014
1.97%
1 jan 2013 ano
0.599
-0.111
-15.67%
1 jan 2014 ano
0.596
-0.003
-0.5%
1 jan 2015 ano
0.624
+0.028
4.66%
Classificação de países por estatísticas atuais por anos


Comentários: