29
/pt/
pt
AIzaSyAYiBZKx7MnpbEhh9jyipgxe19OcubqV5w
April 1, 2024
164023
Japan
JPN
true
2
1
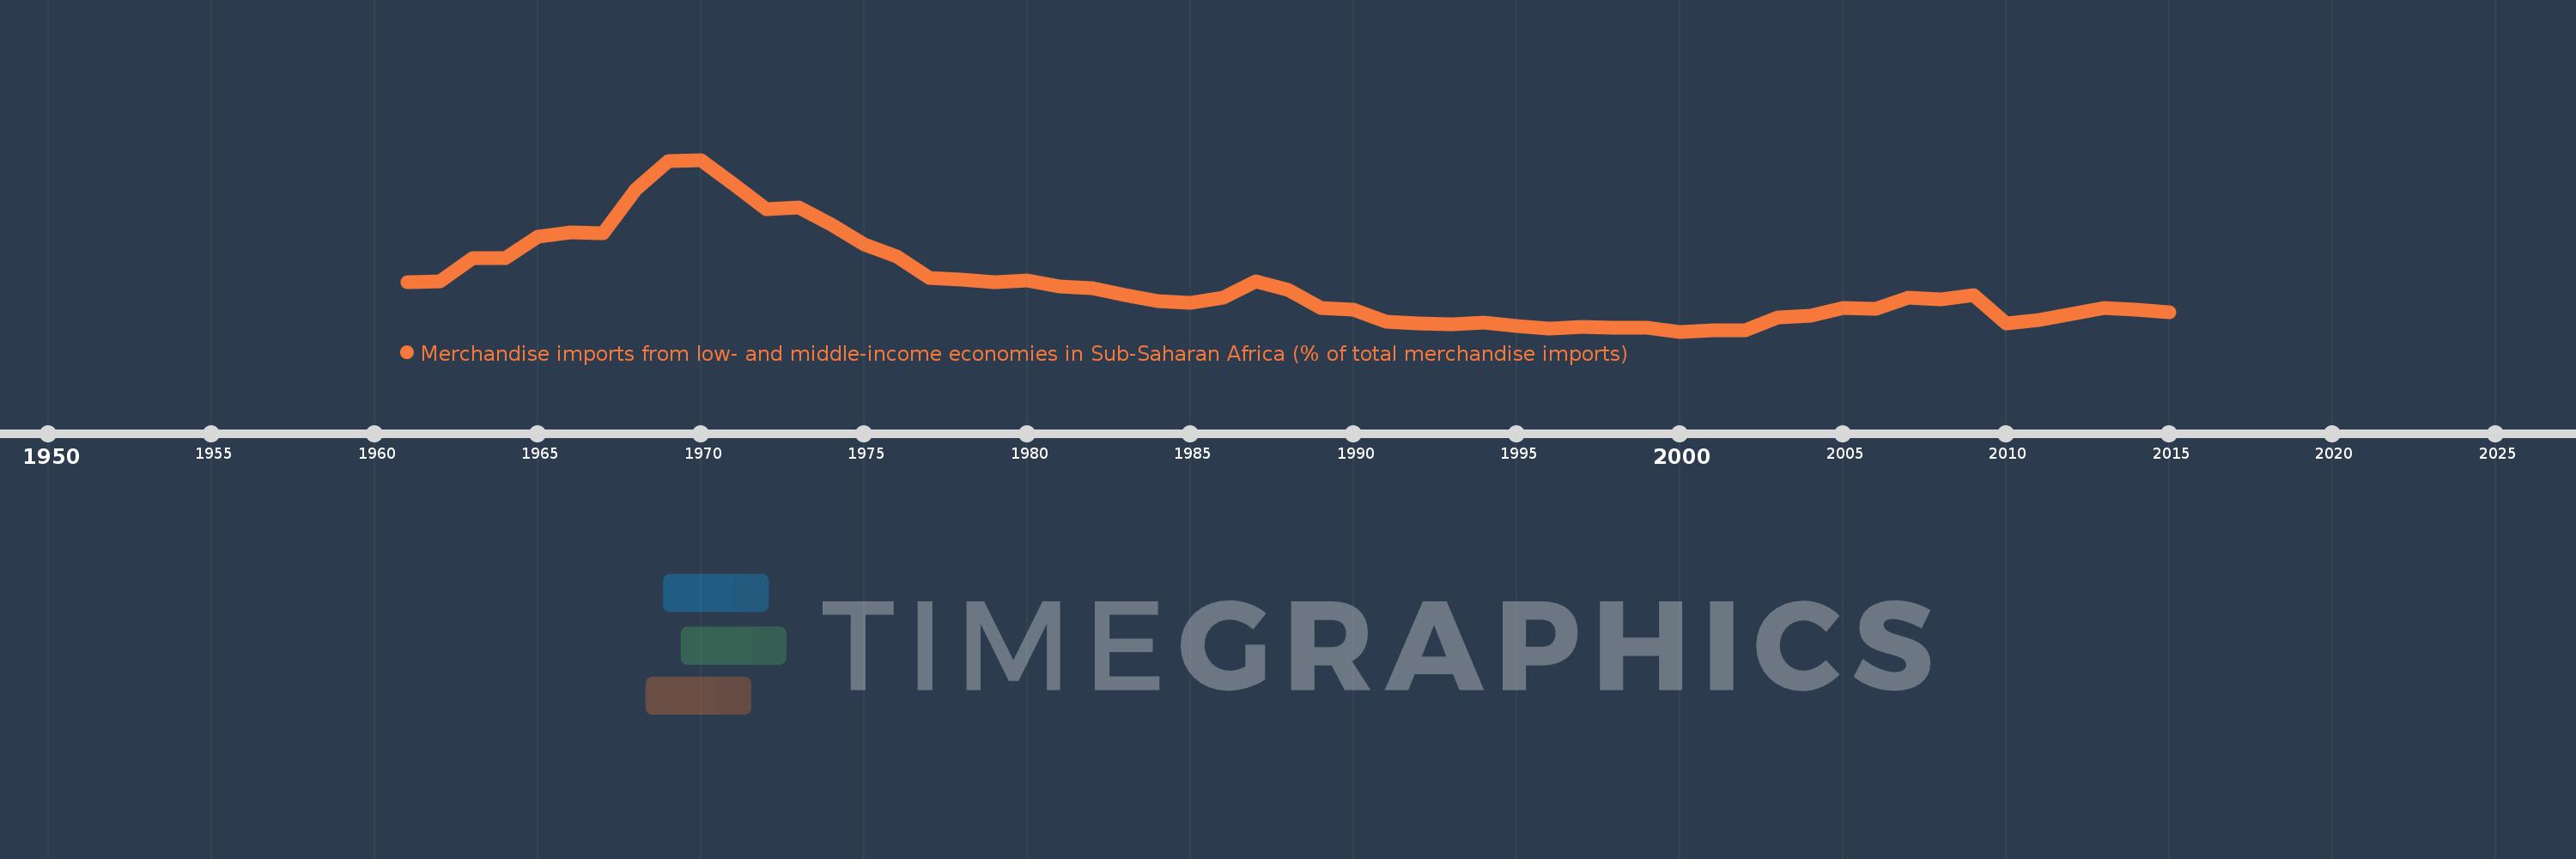
Merchandise imports from low- and middle-income economies in Sub-Saharan Africa (% of total merchandise imports)
2015,2014,2013,2012,2011,2010,2009,2008,2007,2006,2005,2004,2003,2002,2001,2000,1999,1998,1997,1996,1995,1994,1993,1992,1991,1990,1989,1988,1987,1986,1985,1984,1983,1982,1981,1980,1979,1978,1977,1976,1975,1974,1973,1972,1971,1970,1969,1968,1967,1966,1965,1964,1963,1962,1961
Estas estatísticas em outros países:
AlbaniaAlgeriaAngolaArab WorldArgentinaArmeniaArubaAustraliaAustriaAzerbaijanBahamas, TheBahrainBangladeshBarbadosBelarusBelgiumBelizeBeninBermudaBoliviaBrazilBrunei DarussalamBulgariaBurkina FasoBurundiCabo VerdeCambodiaCameroonCanadaCaribbean small statesCentral African RepublicCentral Europe and the BalticsChadChileChinaColombiaCongo, Dem. Rep.Congo, Rep.Costa RicaCote d'IvoireCroatiaCubaCyprusCzech RepublicDenmarkDjiboutiDominicaDominican RepublicEarly-demographic dividendEast Asia & PacificEast Asia & Pacific (excluding high income)East Asia & Pacific (IDA & IBRD countries)EcuadorEgypt, Arab Rep.El SalvadorEstoniaEthiopiaEuro areaEurope & Central AsiaEurope & Central Asia (excluding high income)Europe & Central Asia (IDA & IBRD countries)European UnionFijiFinlandFragile and conflict affected situationsFranceGabonGambia, TheGeorgiaGermanyGhanaGreeceGreenlandGrenadaGuatemalaGuineaGuinea-BissauGuyanaHaitiHeavily indebted poor countries (HIPC)High incomeHondurasHong Kong SAR, ChinaHungaryIBRD onlyIcelandIDA & IBRD totalIDA blendIDA onlyIDA totalIndiaIndonesiaIran, Islamic Rep.IraqIrelandIsraelItalyJamaicaJapanJordanKazakhstanKenyaKorea, Dem. People’s Rep.Korea, Rep.KuwaitLao PDRLate-demographic dividendLatin America & Caribbean Latin America & Caribbean (excluding high income)Latin America & the Caribbean (IDA & IBRD countries)LatviaLeast developed countries: UN classificationLebanonLiberiaLibyaLithuaniaLow & middle incomeLow incomeLower middle incomeLuxembourgMacao SAR, ChinaMacedonia, FYRMadagascarMalawiMalaysiaMaliMaltaMauritaniaMauritiusMexicoMiddle East & North AfricaMiddle East & North Africa (excluding high income)Middle East & North Africa (IDA & IBRD countries)Middle incomeMoldovaMontenegroMoroccoMozambiqueMyanmarNetherlandsNew CaledoniaNew ZealandNicaraguaNigerNigeriaNorth AmericaNorwayOECD membersOmanOther small statesPacific island small statesPakistanPanamaPapua New GuineaParaguayPeruPhilippinesPolandPortugalPost-demographic dividendPre-demographic dividendQatarRomaniaRussian FederationRwandaSaudi ArabiaSenegalSerbiaSeychellesSierra LeoneSingaporeSlovak RepublicSloveniaSmall statesSomaliaSouth AfricaSouth AsiaSouth Asia (IDA & IBRD)SpainSri LankaSt. LuciaSt. Vincent and the GrenadinesSub-Saharan Africa Sub-Saharan Africa (excluding high income)Sub-Saharan Africa (IDA & IBRD countries)SudanSurinameSwedenSwitzerlandSyrian Arab RepublicTanzaniaThailandTogoTrinidad and TobagoTunisiaTurkeyUgandaUkraineUnited Arab EmiratesUnited KingdomUnited StatesUpper middle incomeUruguayVenezuela, RBVietnamWorldYemen, Rep.ZambiaZimbabwe Linha do tempo:
Nesta escala de tempo está apresentado um gráfico de 1961 ano até 2015 ano Japan. Dados de 1960 ano ausente. O número de observações reais por data: 55.
Fonte (nome):
Indicadores de desenvolvimento mundial
Fonte (organização):
World Bank staff estimates based data from International Monetary Fund's Direction of Trade database.
Categorias:
Private Sector, Trade
Foi atualizado:
23 abr 2017 ano
Indicadores de alterações dos valores ao longo dos anos
Mínimo:
1.104
1 jan 2000 ano
Máximo:
6.154
1 jan 1970 ano
Na data de observação
Valor
Mudança absoluta
A alteração em relação ao valor anterior
1 jan 1961 ano
2.549
+2.549
0.0%
1 jan 1962 ano
2.572
+0.024
0.93%
1 jan 1963 ano
3.265
+0.693
26.94%
1 jan 1964 ano
3.268
+0.003
0.09%
1 jan 1965 ano
3.903
+0.635
19.43%
1 jan 1966 ano
4.018
+0.115
2.94%
1 jan 1967 ano
4.001
-0.017
-0.42%
1 jan 1968 ano
5.287
+1.286
32.14%
1 jan 1969 ano
6.126
+0.839
15.86%
1 jan 1970 ano
6.154
+0.028
0.46%
1 jan 1971 ano
5.424
-0.729
-11.85%
1 jan 1972 ano
4.7
-0.724
-13.35%
1 jan 1973 ano
4.744
+0.044
0.93%
1 jan 1974 ano
4.244
-0.5
-10.54%
1 jan 1975 ano
3.67
-0.574
-13.52%
1 jan 1976 ano
3.306
-0.364
-9.93%
1 jan 1977 ano
2.675
-0.63
-19.07%
1 jan 1978 ano
2.641
-0.035
-1.3%
1 jan 1979 ano
2.554
-0.087
-3.28%
1 jan 1980 ano
2.597
+0.043
1.68%
1 jan 1981 ano
2.438
-0.159
-6.14%
1 jan 1982 ano
2.38
-0.058
-2.36%
1 jan 1983 ano
2.189
-0.191
-8.03%
1 jan 1984 ano
1.991
-0.198
-9.05%
1 jan 1985 ano
1.938
-0.053
-2.64%
1 jan 1986 ano
2.107
+0.169
8.72%
1 jan 1987 ano
2.585
+0.478
22.67%
1 jan 1988 ano
2.336
-0.25
-9.65%
1 jan 1989 ano
1.807
-0.528
-22.62%
1 jan 1990 ano
1.736
-0.072
-3.96%
1 jan 1991 ano
1.392
-0.343
-19.79%
1 jan 1992 ano
1.343
-0.049
-3.55%
1 jan 1993 ano
1.323
-0.02
-1.5%
1 jan 1994 ano
1.372
+0.049
3.7%
1 jan 1995 ano
1.277
-0.095
-6.93%
1 jan 1996 ano
1.195
-0.081
-6.37%
1 jan 1997 ano
1.239
+0.043
3.63%
1 jan 1998 ano
1.222
-0.016
-1.32%
1 jan 1999 ano
1.211
-0.012
-0.95%
1 jan 2000 ano
1.104
-0.106
-8.77%
1 jan 2001 ano
1.139
+0.035
3.16%
1 jan 2002 ano
1.15
+0.011
0.97%
1 jan 2003 ano
1.521
+0.371
32.22%
1 jan 2004 ano
1.57
+0.049
3.22%
1 jan 2005 ano
1.802
+0.232
14.77%
1 jan 2006 ano
1.779
-0.023
-1.25%
1 jan 2007 ano
2.091
+0.312
17.54%
1 jan 2008 ano
2.042
-0.049
-2.35%
1 jan 2009 ano
2.181
+0.138
6.78%
1 jan 2010 ano
1.345
-0.835
-38.3%
1 jan 2011 ano
1.455
+0.11
8.15%
1 jan 2012 ano
1.624
+0.169
11.6%
1 jan 2013 ano
1.789
+0.165
10.17%
1 jan 2014 ano
1.755
-0.034
-1.89%
1 jan 2015 ano
1.677
-0.078
-4.44%
Classificação de países por estatísticas atuais por anos


Comentários: