29
/pt/
pt
AIzaSyAYiBZKx7MnpbEhh9jyipgxe19OcubqV5w
April 1, 2024
214575
Norway
NOR
true
2
1
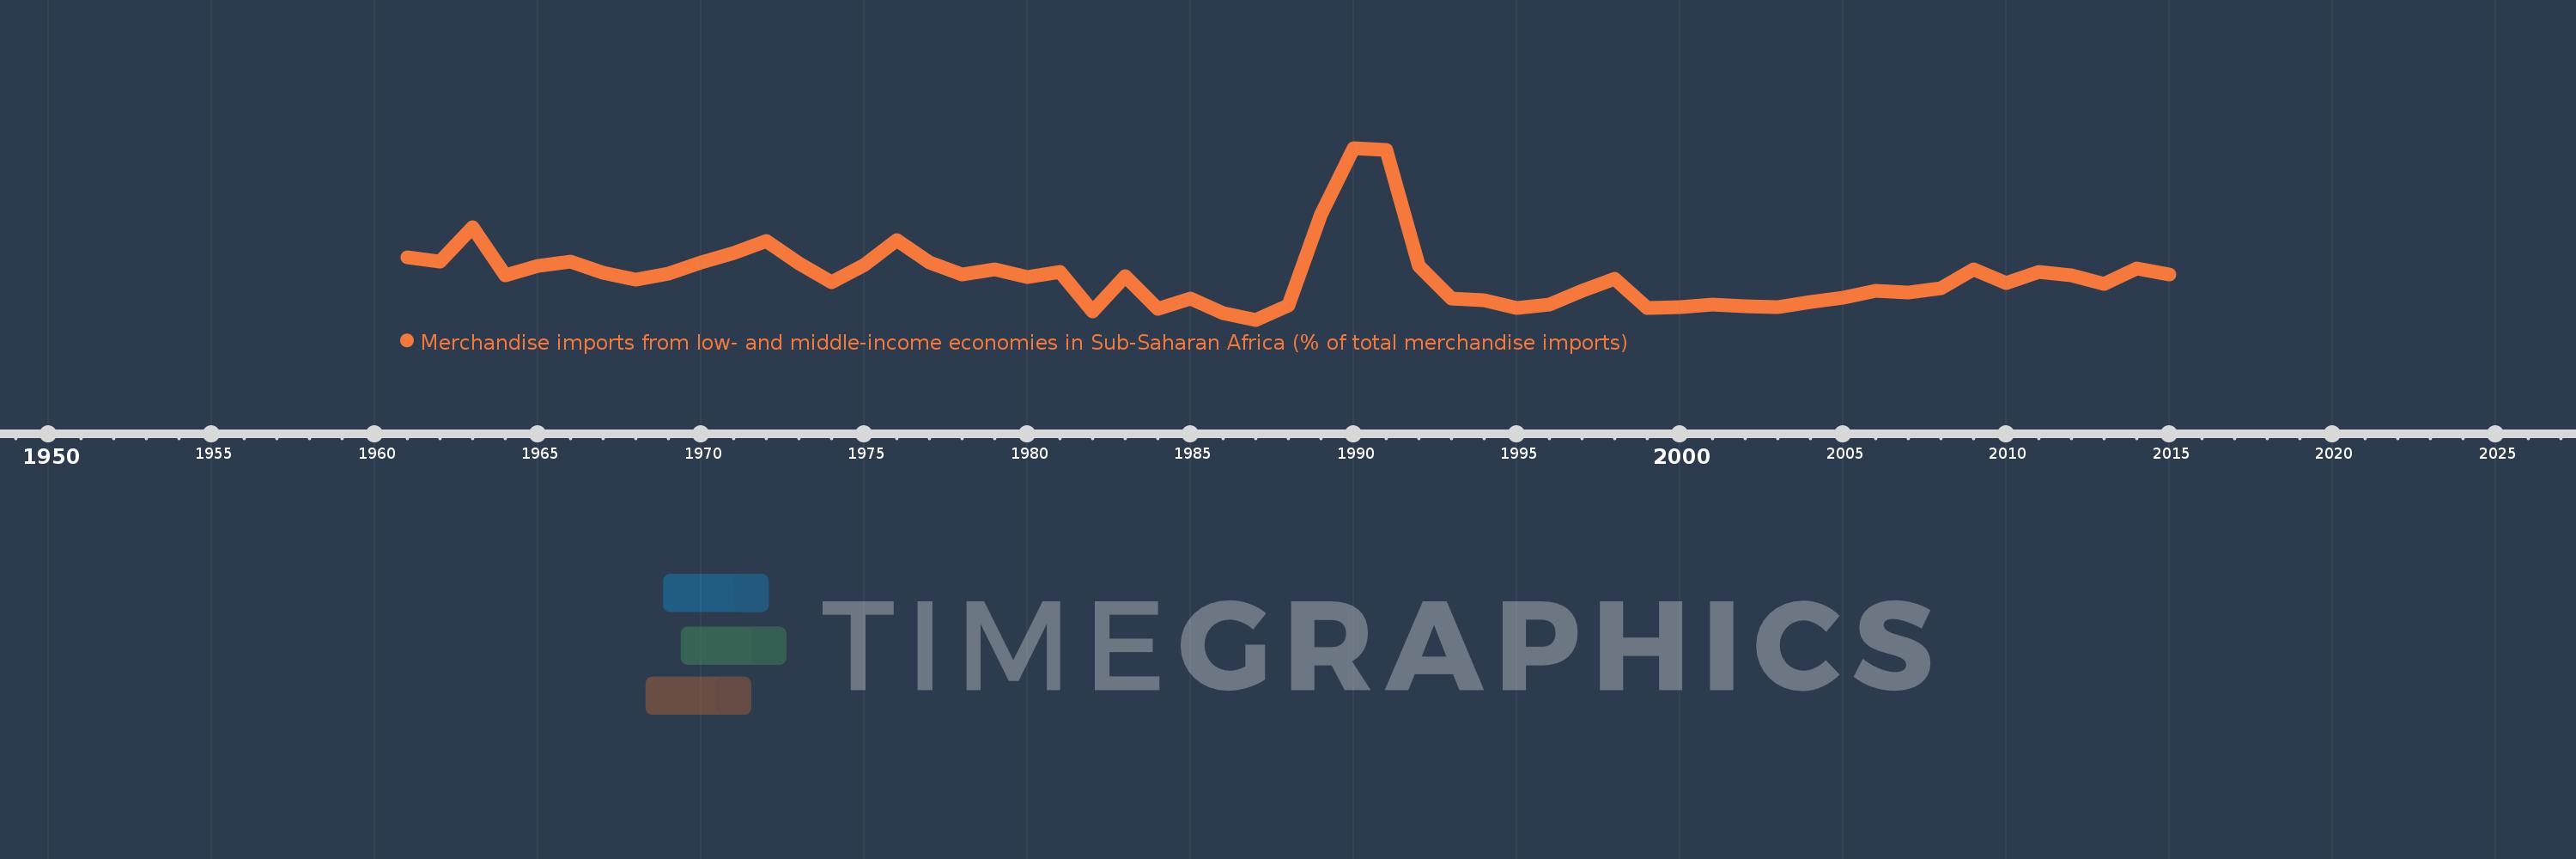
Merchandise imports from low- and middle-income economies in Sub-Saharan Africa (% of total merchandise imports)
2015,2014,2013,2012,2011,2010,2009,2008,2007,2006,2005,2004,2003,2002,2001,2000,1999,1998,1997,1996,1995,1994,1993,1992,1991,1990,1989,1988,1987,1986,1985,1984,1983,1982,1981,1980,1979,1978,1977,1976,1975,1974,1973,1972,1971,1970,1969,1968,1967,1966,1965,1964,1963,1962,1961
Estas estatísticas em outros países:
AlbaniaAlgeriaAngolaArab WorldArgentinaArmeniaArubaAustraliaAustriaAzerbaijanBahamas, TheBahrainBangladeshBarbadosBelarusBelgiumBelizeBeninBermudaBoliviaBrazilBrunei DarussalamBulgariaBurkina FasoBurundiCabo VerdeCambodiaCameroonCanadaCaribbean small statesCentral African RepublicCentral Europe and the BalticsChadChileChinaColombiaCongo, Dem. Rep.Congo, Rep.Costa RicaCote d'IvoireCroatiaCubaCyprusCzech RepublicDenmarkDjiboutiDominicaDominican RepublicEarly-demographic dividendEast Asia & PacificEast Asia & Pacific (excluding high income)East Asia & Pacific (IDA & IBRD countries)EcuadorEgypt, Arab Rep.El SalvadorEstoniaEthiopiaEuro areaEurope & Central AsiaEurope & Central Asia (excluding high income)Europe & Central Asia (IDA & IBRD countries)European UnionFijiFinlandFragile and conflict affected situationsFranceGabonGambia, TheGeorgiaGermanyGhanaGreeceGreenlandGrenadaGuatemalaGuineaGuinea-BissauGuyanaHaitiHeavily indebted poor countries (HIPC)High incomeHondurasHong Kong SAR, ChinaHungaryIBRD onlyIcelandIDA & IBRD totalIDA blendIDA onlyIDA totalIndiaIndonesiaIran, Islamic Rep.IraqIrelandIsraelItalyJamaicaJapanJordanKazakhstanKenyaKorea, Dem. People’s Rep.Korea, Rep.KuwaitLao PDRLate-demographic dividendLatin America & Caribbean Latin America & Caribbean (excluding high income)Latin America & the Caribbean (IDA & IBRD countries)LatviaLeast developed countries: UN classificationLebanonLiberiaLibyaLithuaniaLow & middle incomeLow incomeLower middle incomeLuxembourgMacao SAR, ChinaMacedonia, FYRMadagascarMalawiMalaysiaMaliMaltaMauritaniaMauritiusMexicoMiddle East & North AfricaMiddle East & North Africa (excluding high income)Middle East & North Africa (IDA & IBRD countries)Middle incomeMoldovaMontenegroMoroccoMozambiqueMyanmarNetherlandsNew CaledoniaNew ZealandNicaraguaNigerNigeriaNorth AmericaNorwayOECD membersOmanOther small statesPacific island small statesPakistanPanamaPapua New GuineaParaguayPeruPhilippinesPolandPortugalPost-demographic dividendPre-demographic dividendQatarRomaniaRussian FederationRwandaSaudi ArabiaSenegalSerbiaSeychellesSierra LeoneSingaporeSlovak RepublicSloveniaSmall statesSomaliaSouth AfricaSouth AsiaSouth Asia (IDA & IBRD)SpainSri LankaSt. LuciaSt. Vincent and the GrenadinesSub-Saharan Africa Sub-Saharan Africa (excluding high income)Sub-Saharan Africa (IDA & IBRD countries)SudanSurinameSwedenSwitzerlandSyrian Arab RepublicTanzaniaThailandTogoTrinidad and TobagoTunisiaTurkeyUgandaUkraineUnited Arab EmiratesUnited KingdomUnited StatesUpper middle incomeUruguayVenezuela, RBVietnamWorldYemen, Rep.ZambiaZimbabwe Linha do tempo:
Nesta escala de tempo está apresentado um gráfico de 1961 ano até 2015 ano Norway. Dados de 1960 ano ausente. O número de observações reais por data: 55.
Fonte (nome):
Indicadores de desenvolvimento mundial
Fonte (organização):
World Bank staff estimates based data from International Monetary Fund's Direction of Trade database.
Categorias:
Private Sector, Trade
Foi atualizado:
23 abr 2017 ano
Indicadores de alterações dos valores ao longo dos anos
Mínimo:
0.387
1 jan 1987 ano
Máximo:
4.314
1 jan 1990 ano
Na data de observação
Valor
Mudança absoluta
A alteração em relação ao valor anterior
1 jan 1961 ano
1.823
+1.823
0.0%
1 jan 1962 ano
1.716
-0.107
-5.87%
1 jan 1963 ano
2.503
+0.787
45.86%
1 jan 1964 ano
1.404
-1.099
-43.89%
1 jan 1965 ano
1.621
+0.217
15.47%
1 jan 1966 ano
1.707
+0.085
5.26%
1 jan 1967 ano
1.457
-0.25
-14.63%
1 jan 1968 ano
1.3
-0.157
-10.77%
1 jan 1969 ano
1.442
+0.142
10.89%
1 jan 1970 ano
1.695
+0.253
17.54%
1 jan 1971 ano
1.907
+0.213
12.55%
1 jan 1972 ano
2.18
+0.273
14.29%
1 jan 1973 ano
1.668
-0.512
-23.48%
1 jan 1974 ano
1.241
-0.427
-25.59%
1 jan 1975 ano
1.645
+0.403
32.5%
1 jan 1976 ano
2.206
+0.562
34.16%
1 jan 1977 ano
1.693
-0.513
-23.25%
1 jan 1978 ano
1.428
-0.265
-15.64%
1 jan 1979 ano
1.541
+0.113
7.9%
1 jan 1980 ano
1.354
-0.188
-12.17%
1 jan 1981 ano
1.471
+0.117
8.68%
1 jan 1982 ano
0.579
-0.892
-60.62%
1 jan 1983 ano
1.391
+0.812
140.17%
1 jan 1984 ano
0.64
-0.752
-54.02%
1 jan 1985 ano
0.881
+0.241
37.73%
1 jan 1986 ano
0.531
-0.35
-39.71%
1 jan 1987 ano
0.387
-0.144
-27.07%
1 jan 1988 ano
0.712
+0.324
83.67%
1 jan 1989 ano
2.8
+2.088
293.45%
1 jan 1990 ano
4.314
+1.514
54.08%
1 jan 1991 ano
4.278
-0.036
-0.83%
1 jan 1992 ano
1.625
-2.653
-62.02%
1 jan 1993 ano
0.871
-0.754
-46.41%
1 jan 1994 ano
0.837
-0.034
-3.87%
1 jan 1995 ano
0.662
-0.175
-20.88%
1 jan 1996 ano
0.734
+0.072
10.89%
1 jan 1997 ano
1.056
+0.322
43.84%
1 jan 1998 ano
1.322
+0.265
25.13%
1 jan 1999 ano
0.655
-0.667
-50.47%
1 jan 2000 ano
0.679
+0.025
3.76%
1 jan 2001 ano
0.727
+0.048
7.07%
1 jan 2002 ano
0.699
-0.029
-3.95%
1 jan 2003 ano
0.677
-0.022
-3.13%
1 jan 2004 ano
0.803
+0.126
18.59%
1 jan 2005 ano
0.883
+0.08
10.0%
1 jan 2006 ano
1.05
+0.167
18.91%
1 jan 2007 ano
1.017
-0.033
-3.17%
1 jan 2008 ano
1.106
+0.089
8.79%
1 jan 2009 ano
1.542
+0.436
39.45%
1 jan 2010 ano
1.231
-0.311
-20.16%
1 jan 2011 ano
1.472
+0.241
19.54%
1 jan 2012 ano
1.406
-0.066
-4.51%
1 jan 2013 ano
1.208
-0.197
-14.04%
1 jan 2014 ano
1.551
+0.343
28.37%
1 jan 2015 ano
1.425
-0.126
-8.12%
Classificação de países por estatísticas atuais por anos


Comentários: