29
/pt/
pt
AIzaSyAYiBZKx7MnpbEhh9jyipgxe19OcubqV5w
April 1, 2024
64310
Albania
ALB
true
2
1
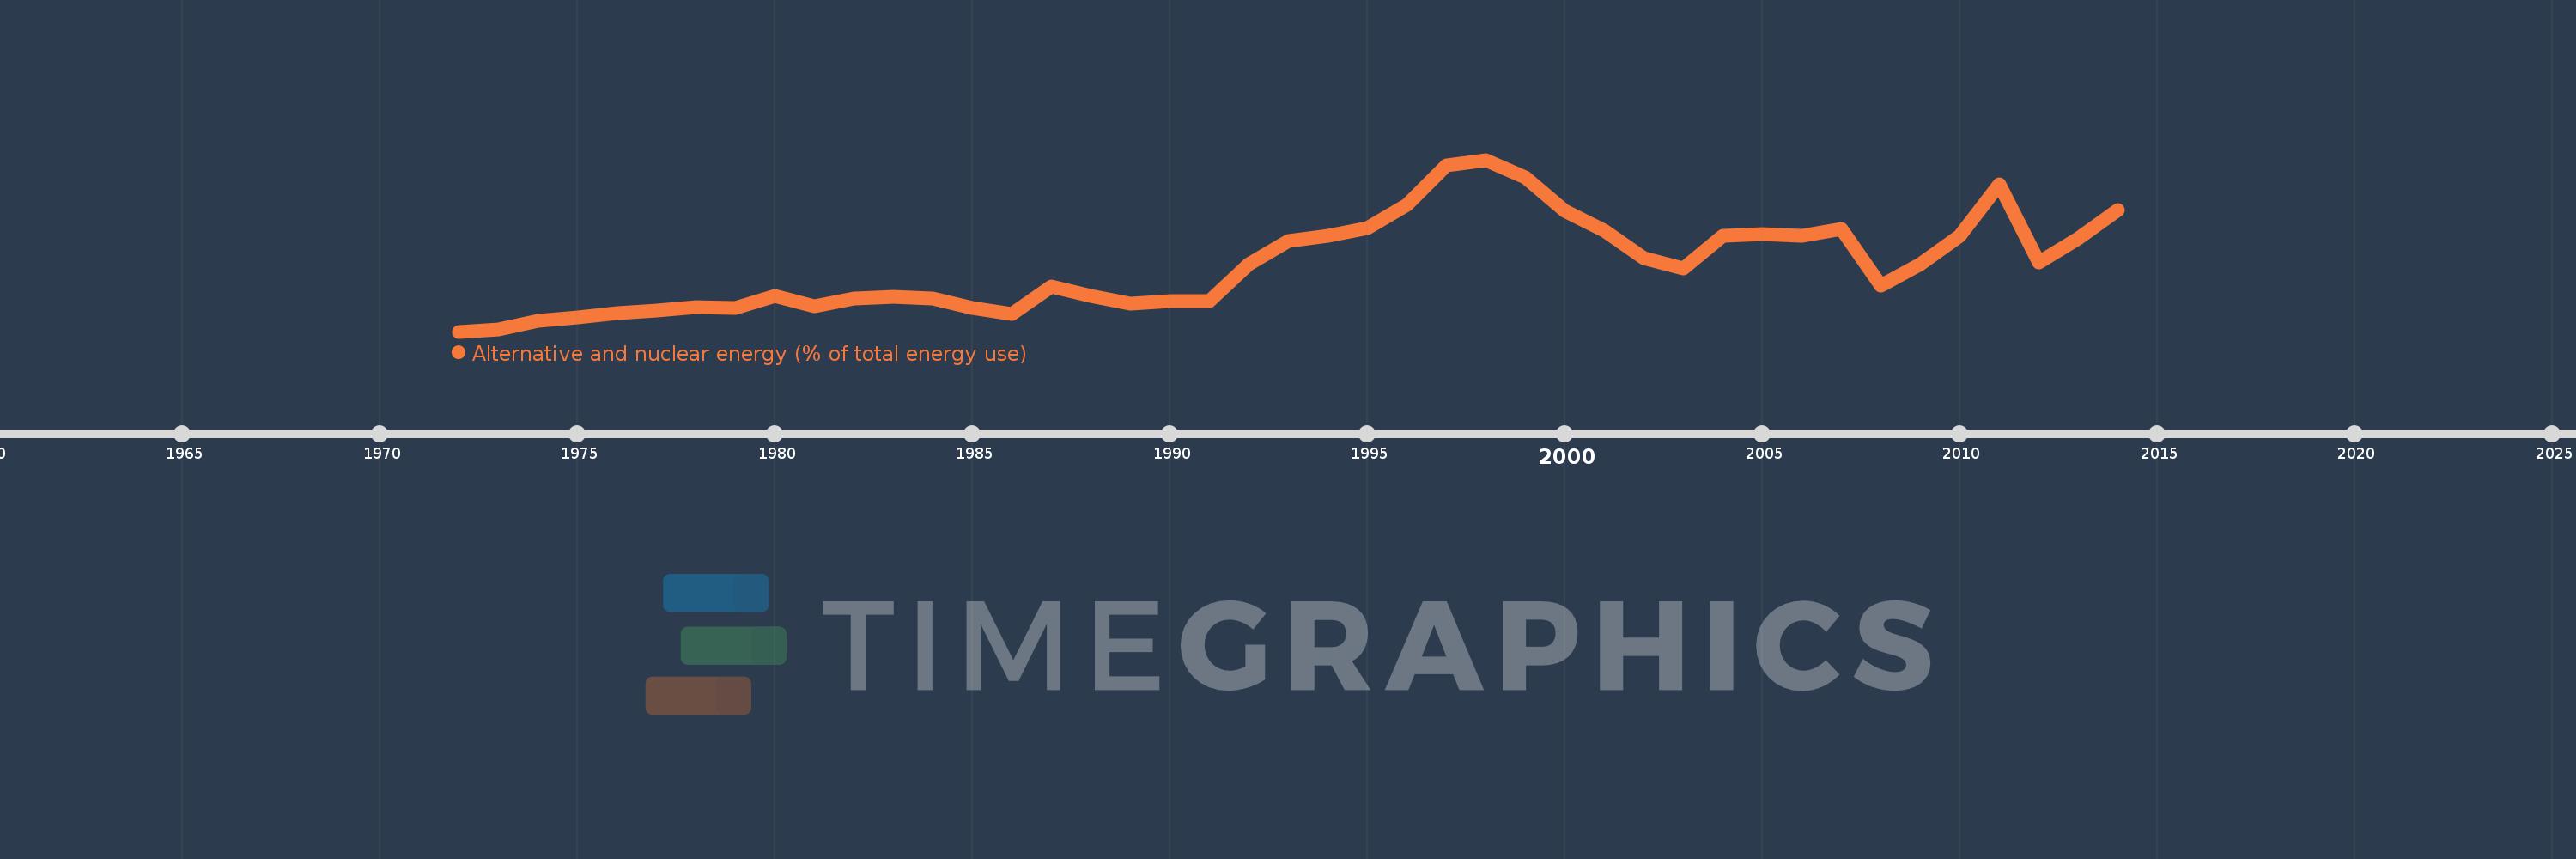
Alternative and nuclear energy (% of total energy use)
2014,2013,2012,2011,2010,2009,2008,2007,2006,2005,2004,2003,2002,2001,2000,1999,1998,1997,1996,1995,1994,1993,1992,1991,1990,1989,1988,1987,1986,1985,1984,1983,1982,1981,1980,1979,1978,1977,1976,1975,1974,1973,1972
Estas estatísticas em outros países:
AlbaniaAlgeriaAngolaArab WorldArgentinaArmeniaAustraliaAustriaAzerbaijanBahrainBangladeshBelarusBelgiumBeninBoliviaBosnia and HerzegovinaBotswanaBrazilBrunei DarussalamBulgariaCambodiaCameroonCanadaCaribbean small statesCentral Europe and the BalticsChileChinaColombiaCongo, Dem. Rep.Congo, Rep.Costa RicaCote d'IvoireCroatiaCubaCuracaoCyprusCzech RepublicDenmarkDominican RepublicEarly-demographic dividendEast Asia & PacificEast Asia & Pacific (excluding high income)East Asia & Pacific (IDA & IBRD countries)EcuadorEgypt, Arab Rep.El SalvadorEritreaEstoniaEthiopiaEuro areaEurope & Central AsiaEurope & Central Asia (excluding high income)Europe & Central Asia (IDA & IBRD countries)European UnionFinlandFragile and conflict affected situationsFranceGabonGeorgiaGermanyGhanaGibraltarGreeceGuatemalaHaitiHeavily indebted poor countries (HIPC)High incomeHondurasHong Kong SAR, ChinaHungaryIBRD onlyIcelandIDA & IBRD totalIDA blendIDA onlyIDA totalIndiaIndonesiaIran, Islamic Rep.IraqIrelandIsraelItalyJamaicaJapanJordanKazakhstanKenyaKorea, Dem. People’s Rep.Korea, Rep.KosovoKuwaitKyrgyz RepublicLate-demographic dividendLatin America & Caribbean Latin America & Caribbean (excluding high income)Latin America & the Caribbean (IDA & IBRD countries)LatviaLeast developed countries: UN classificationLebanonLibyaLithuaniaLow & middle incomeLow incomeLower middle incomeLuxembourgMacedonia, FYRMalaysiaMaltaMauritiusMexicoMiddle East & North AfricaMiddle East & North Africa (excluding high income)Middle East & North Africa (IDA & IBRD countries)Middle incomeMoldovaMongoliaMontenegroMoroccoMozambiqueMyanmarNamibiaNepalNetherlandsNew ZealandNicaraguaNigerNigeriaNorth AmericaNorwayOECD membersOmanOther small statesPakistanPanamaParaguayPeruPhilippinesPolandPortugalPost-demographic dividendPre-demographic dividendQatarRomaniaRussian FederationSaudi ArabiaSenegalSerbiaSingaporeSlovak RepublicSloveniaSmall statesSouth AfricaSouth AsiaSouth Asia (IDA & IBRD)South SudanSpainSri LankaSub-Saharan Africa Sub-Saharan Africa (excluding high income)Sub-Saharan Africa (IDA & IBRD countries)SudanSwedenSwitzerlandSyrian Arab RepublicTajikistanTanzaniaThailandTogoTrinidad and TobagoTunisiaTurkeyTurkmenistanUkraineUnited Arab EmiratesUnited KingdomUnited StatesUpper middle incomeUruguayUzbekistanVenezuela, RBVietnamWorldYemen, Rep.ZambiaZimbabwe Linha do tempo:
Nesta escala de tempo está apresentado um gráfico de 1972 ano até 2014 ano Albania. Dados de 1971 ano ausente. O número de observações reais por data: 43.
Fonte (nome):
Indicadores de desenvolvimento mundial
Fonte (organização):
IEA Statistics © OECD/IEA 2014 (http://www.iea.org/stats/index.asp), subject to https://www.iea.org/t&c/termsandconditions/
Categorias:
Energy & Mining
Foi atualizado:
23 abr 2017 ano
Indicadores de alterações dos valores ao longo dos anos
Mínimo:
3.504
1 jan 1972 ano
Máximo:
35.712
1 jan 1998 ano
Na data de observação
Valor
Mudança absoluta
A alteração em relação ao valor anterior
1 jan 1972 ano
3.504
+3.504
0.0%
1 jan 1973 ano
3.986
+0.482
13.75%
1 jan 1974 ano
5.533
+1.546
38.79%
1 jan 1975 ano
6.123
+0.59
10.67%
1 jan 1976 ano
6.919
+0.796
13.0%
1 jan 1977 ano
7.46
+0.541
7.81%
1 jan 1978 ano
8.149
+0.689
9.24%
1 jan 1979 ano
7.957
-0.192
-2.36%
1 jan 1980 ano
10.264
+2.307
28.99%
1 jan 1981 ano
8.26
-2.004
-19.53%
1 jan 1982 ano
9.727
+1.467
17.77%
1 jan 1983 ano
9.985
+0.258
2.65%
1 jan 1984 ano
9.675
-0.31
-3.1%
1 jan 1985 ano
7.965
-1.711
-17.68%
1 jan 1986 ano
6.741
-1.224
-15.36%
1 jan 1987 ano
11.987
+5.246
77.82%
1 jan 1988 ano
10.135
-1.852
-15.45%
1 jan 1989 ano
8.67
-1.465
-14.45%
1 jan 1990 ano
9.148
+0.478
5.51%
1 jan 1991 ano
9.164
+0.016
0.17%
1 jan 1992 ano
16.169
+7.005
76.45%
1 jan 1993 ano
20.427
+4.258
26.33%
1 jan 1994 ano
21.415
+0.988
4.84%
1 jan 1995 ano
22.914
+1.499
7.0%
1 jan 1996 ano
27.196
+4.282
18.69%
1 jan 1997 ano
34.708
+7.512
27.62%
1 jan 1998 ano
35.712
+1.004
2.89%
1 jan 1999 ano
32.399
-3.313
-9.28%
1 jan 2000 ano
26.07
-6.33
-19.54%
1 jan 2001 ano
22.467
-3.602
-13.82%
1 jan 2002 ano
17.225
-5.243
-23.33%
1 jan 2003 ano
15.418
-1.807
-10.49%
1 jan 2004 ano
21.425
+6.008
38.97%
1 jan 2005 ano
21.77
+0.345
1.61%
1 jan 2006 ano
21.429
-0.341
-1.57%
1 jan 2007 ano
22.754
+1.325
6.18%
1 jan 2008 ano
12.187
-10.567
-46.44%
1 jan 2009 ano
16.212
+4.025
33.03%
1 jan 2010 ano
21.458
+5.247
32.36%
1 jan 2011 ano
31.15
+9.692
45.16%
1 jan 2012 ano
16.403
-14.747
-47.34%
1 jan 2013 ano
21.018
+4.615
28.13%
1 jan 2014 ano
26.321
+5.302
25.23%
Classificação de países por estatísticas atuais por anos


Comentários: