29
/pt/
pt
AIzaSyAYiBZKx7MnpbEhh9jyipgxe19OcubqV5w
April 1, 2024
202550
Mozambique
MOZ
true
2
1
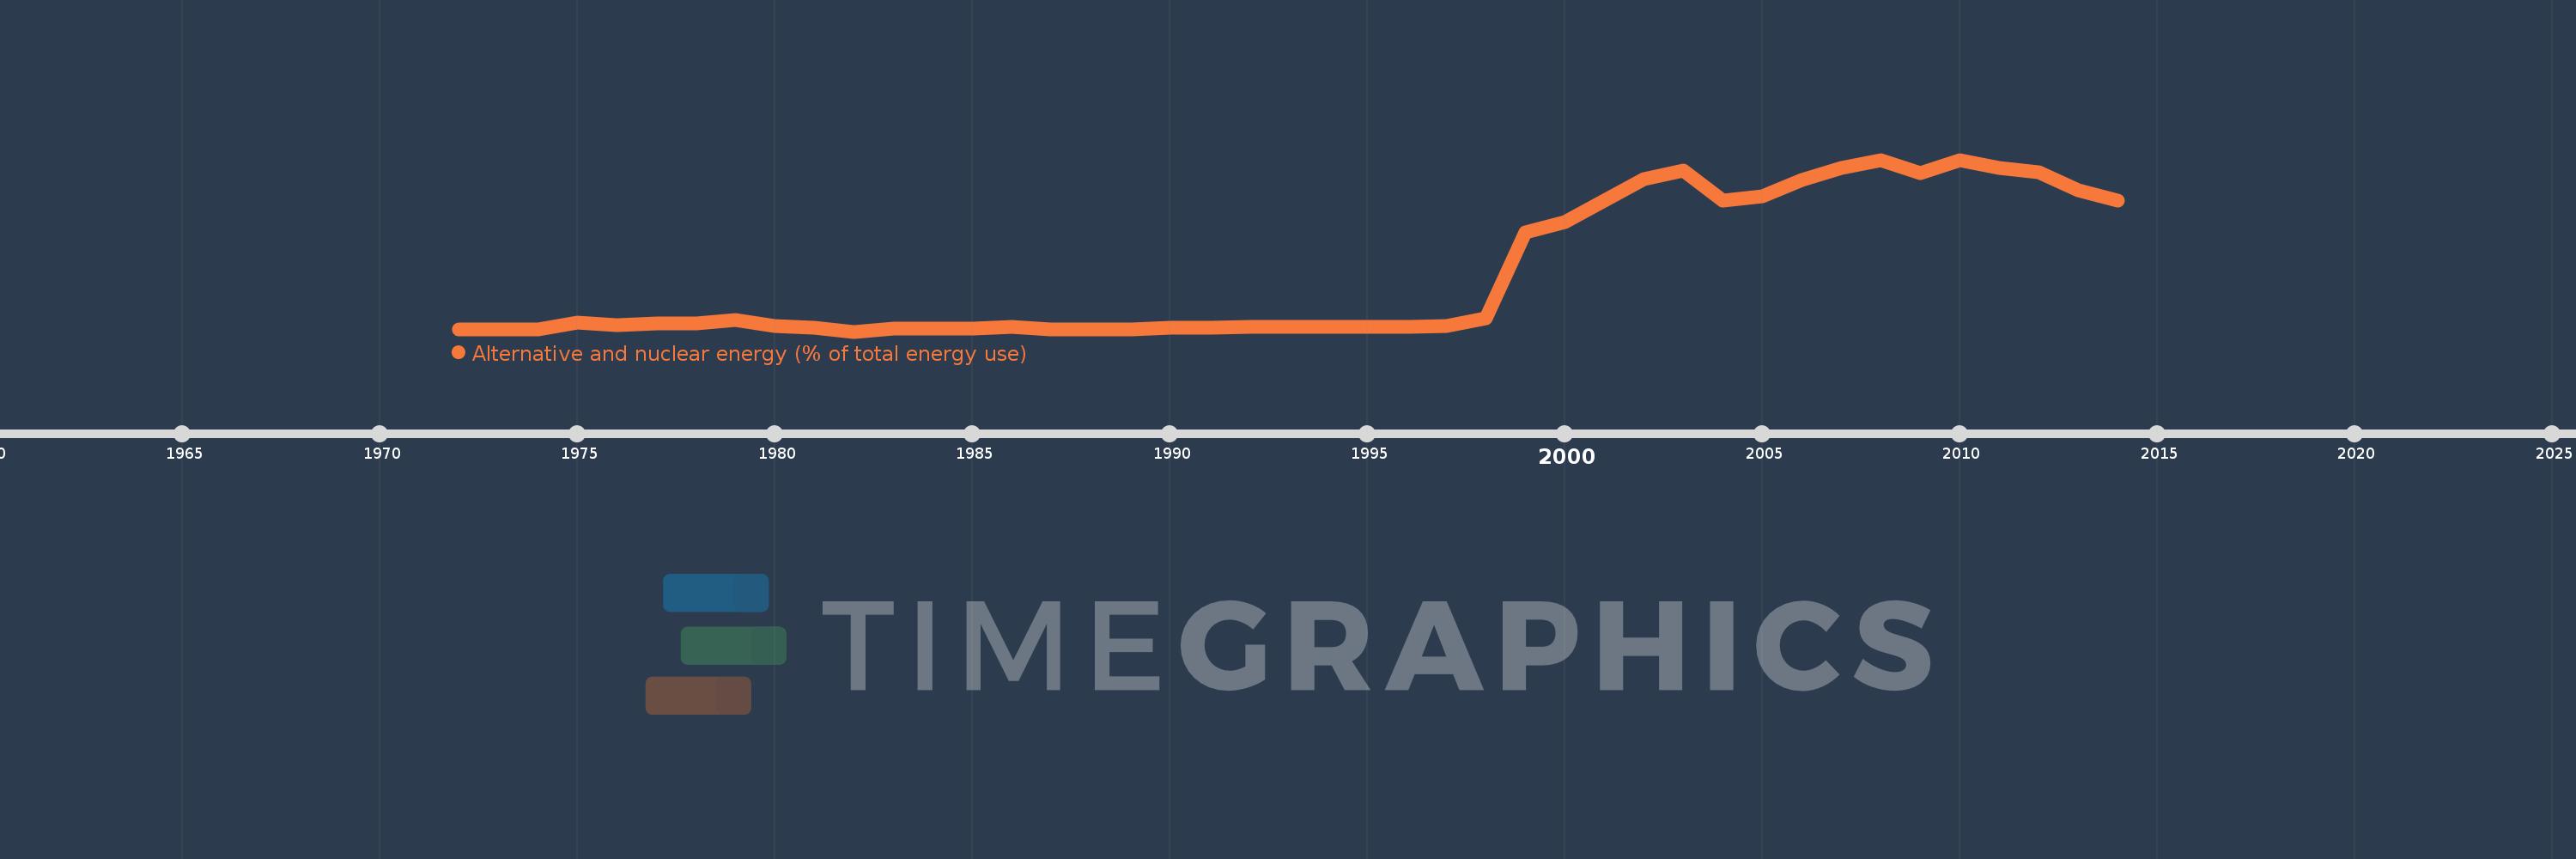
Alternative and nuclear energy (% of total energy use)
2014,2013,2012,2011,2010,2009,2008,2007,2006,2005,2004,2003,2002,2001,2000,1999,1998,1997,1996,1995,1994,1993,1992,1991,1990,1989,1988,1987,1986,1985,1984,1983,1982,1981,1980,1979,1978,1977,1976,1975,1974,1973,1972
Estas estatísticas em outros países:
AlbaniaAlgeriaAngolaArab WorldArgentinaArmeniaAustraliaAustriaAzerbaijanBahrainBangladeshBelarusBelgiumBeninBoliviaBosnia and HerzegovinaBotswanaBrazilBrunei DarussalamBulgariaCambodiaCameroonCanadaCaribbean small statesCentral Europe and the BalticsChileChinaColombiaCongo, Dem. Rep.Congo, Rep.Costa RicaCote d'IvoireCroatiaCubaCuracaoCyprusCzech RepublicDenmarkDominican RepublicEarly-demographic dividendEast Asia & PacificEast Asia & Pacific (excluding high income)East Asia & Pacific (IDA & IBRD countries)EcuadorEgypt, Arab Rep.El SalvadorEritreaEstoniaEthiopiaEuro areaEurope & Central AsiaEurope & Central Asia (excluding high income)Europe & Central Asia (IDA & IBRD countries)European UnionFinlandFragile and conflict affected situationsFranceGabonGeorgiaGermanyGhanaGibraltarGreeceGuatemalaHaitiHeavily indebted poor countries (HIPC)High incomeHondurasHong Kong SAR, ChinaHungaryIBRD onlyIcelandIDA & IBRD totalIDA blendIDA onlyIDA totalIndiaIndonesiaIran, Islamic Rep.IraqIrelandIsraelItalyJamaicaJapanJordanKazakhstanKenyaKorea, Dem. People’s Rep.Korea, Rep.KosovoKuwaitKyrgyz RepublicLate-demographic dividendLatin America & Caribbean Latin America & Caribbean (excluding high income)Latin America & the Caribbean (IDA & IBRD countries)LatviaLeast developed countries: UN classificationLebanonLibyaLithuaniaLow & middle incomeLow incomeLower middle incomeLuxembourgMacedonia, FYRMalaysiaMaltaMauritiusMexicoMiddle East & North AfricaMiddle East & North Africa (excluding high income)Middle East & North Africa (IDA & IBRD countries)Middle incomeMoldovaMongoliaMontenegroMoroccoMozambiqueMyanmarNamibiaNepalNetherlandsNew ZealandNicaraguaNigerNigeriaNorth AmericaNorwayOECD membersOmanOther small statesPakistanPanamaParaguayPeruPhilippinesPolandPortugalPost-demographic dividendPre-demographic dividendQatarRomaniaRussian FederationSaudi ArabiaSenegalSerbiaSingaporeSlovak RepublicSloveniaSmall statesSouth AfricaSouth AsiaSouth Asia (IDA & IBRD)South SudanSpainSri LankaSub-Saharan Africa Sub-Saharan Africa (excluding high income)Sub-Saharan Africa (IDA & IBRD countries)SudanSwedenSwitzerlandSyrian Arab RepublicTajikistanTanzaniaThailandTogoTrinidad and TobagoTunisiaTurkeyTurkmenistanUkraineUnited Arab EmiratesUnited KingdomUnited StatesUpper middle incomeUruguayUzbekistanVenezuela, RBVietnamWorldYemen, Rep.ZambiaZimbabwe Linha do tempo:
Nesta escala de tempo está apresentado um gráfico de 1972 ano até 2014 ano Mozambique. Dados de 1971 ano ausente. O número de observações reais por data: 43.
Fonte (nome):
Indicadores de desenvolvimento mundial
Fonte (organização):
IEA Statistics © OECD/IEA 2014 (http://www.iea.org/stats/index.asp), subject to https://www.iea.org/t&c/termsandconditions/
Categorias:
Energy & Mining
Foi atualizado:
23 abr 2017 ano
Indicadores de alterações dos valores ao longo dos anos
Mínimo:
0.075
1 jan 1982 ano
Máximo:
15.189
1 jan 2010 ano
Na data de observação
Valor
Mudança absoluta
A alteração em relação ao valor anterior
1 jan 1972 ano
0.279
+0.279
0.0%
1 jan 1973 ano
0.271
-0.009
-3.09%
1 jan 1974 ano
0.242
-0.029
-10.75%
1 jan 1975 ano
0.852
+0.61
252.65%
1 jan 1976 ano
0.672
-0.18
-21.13%
1 jan 1977 ano
0.798
+0.126
18.71%
1 jan 1978 ano
0.8
+0.003
0.33%
1 jan 1979 ano
1.062
+0.261
32.63%
1 jan 1980 ano
0.559
-0.503
-47.38%
1 jan 1981 ano
0.385
-0.173
-31.05%
1 jan 1982 ano
0.075
-0.31
-80.58%
1 jan 1983 ano
0.333
+0.259
345.62%
1 jan 1984 ano
0.313
-0.02
-6.08%
1 jan 1985 ano
0.328
+0.015
4.81%
1 jan 1986 ano
0.507
+0.178
54.38%
1 jan 1987 ano
0.236
-0.27
-53.38%
1 jan 1988 ano
0.248
+0.012
5.11%
1 jan 1989 ano
0.232
-0.017
-6.66%
1 jan 1990 ano
0.401
+0.169
72.91%
1 jan 1991 ano
0.412
+0.012
2.96%
1 jan 1992 ano
0.471
+0.059
14.27%
1 jan 1993 ano
0.468
-0.003
-0.65%
1 jan 1994 ano
0.486
+0.018
3.81%
1 jan 1995 ano
0.512
+0.026
5.29%
1 jan 1996 ano
0.519
+0.007
1.35%
1 jan 1997 ano
0.603
+0.085
16.3%
1 jan 1998 ano
1.275
+0.671
111.31%
1 jan 1999 ano
8.832
+7.557
592.91%
1 jan 2000 ano
9.737
+0.905
10.24%
1 jan 2001 ano
11.573
+1.836
18.86%
1 jan 2002 ano
13.494
+1.921
16.6%
1 jan 2003 ano
14.257
+0.763
5.66%
1 jan 2004 ano
11.595
-2.662
-18.67%
1 jan 2005 ano
11.982
+0.387
3.34%
1 jan 2006 ano
13.438
+1.456
12.15%
1 jan 2007 ano
14.477
+1.04
7.74%
1 jan 2008 ano
15.169
+0.692
4.78%
1 jan 2009 ano
14.021
-1.149
-7.57%
1 jan 2010 ano
15.189
+1.168
8.33%
1 jan 2011 ano
14.463
-0.726
-4.78%
1 jan 2012 ano
14.072
-0.391
-2.7%
1 jan 2013 ano
12.479
-1.593
-11.32%
1 jan 2014 ano
11.602
-0.876
-7.02%
Classificação de países por estatísticas atuais por anos


Comentários: