29
/pt/
pt
AIzaSyAYiBZKx7MnpbEhh9jyipgxe19OcubqV5w
April 1, 2024
123124
Ecuador
ECU
true
2
1
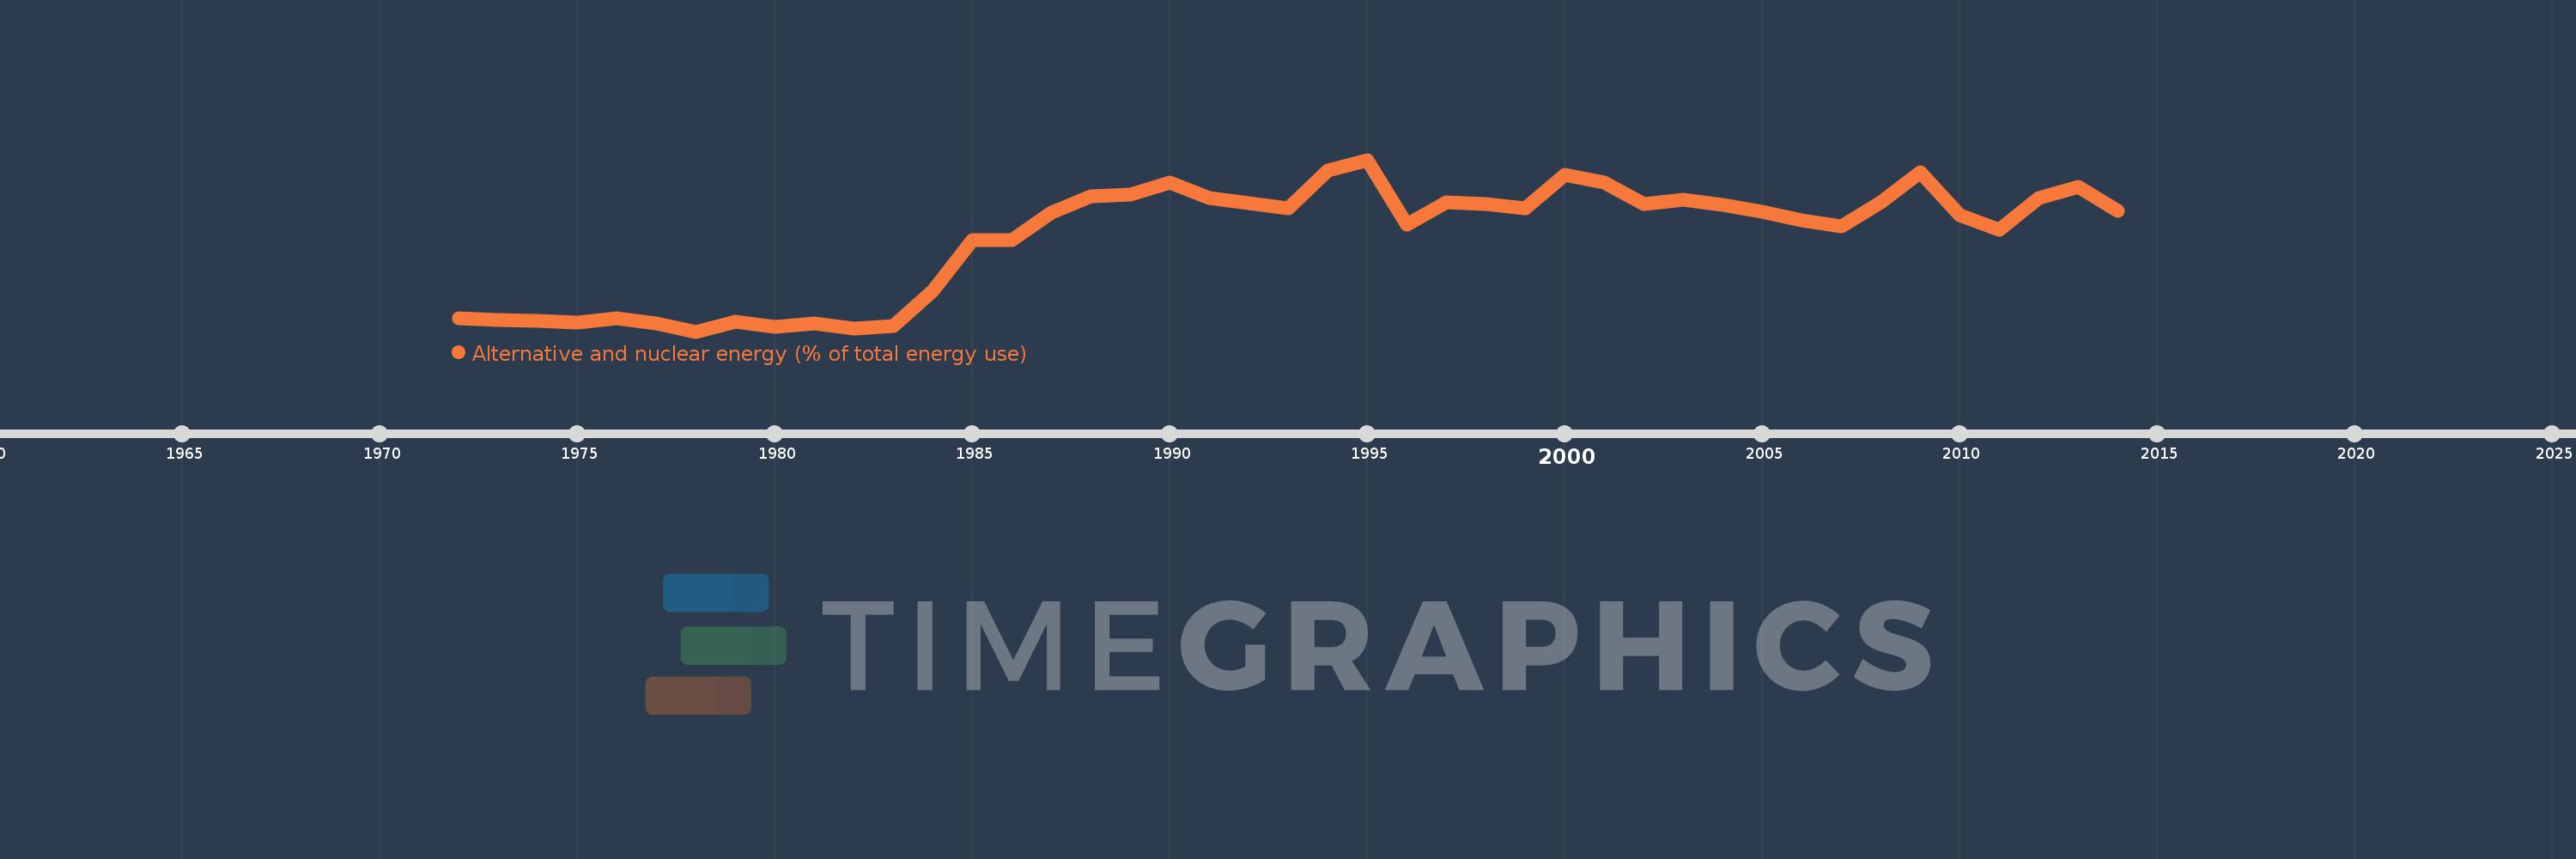
Alternative and nuclear energy (% of total energy use)
2014,2013,2012,2011,2010,2009,2008,2007,2006,2005,2004,2003,2002,2001,2000,1999,1998,1997,1996,1995,1994,1993,1992,1991,1990,1989,1988,1987,1986,1985,1984,1983,1982,1981,1980,1979,1978,1977,1976,1975,1974,1973,1972
Estas estatísticas em outros países:
AlbaniaAlgeriaAngolaArab WorldArgentinaArmeniaAustraliaAustriaAzerbaijanBahrainBangladeshBelarusBelgiumBeninBoliviaBosnia and HerzegovinaBotswanaBrazilBrunei DarussalamBulgariaCambodiaCameroonCanadaCaribbean small statesCentral Europe and the BalticsChileChinaColombiaCongo, Dem. Rep.Congo, Rep.Costa RicaCote d'IvoireCroatiaCubaCuracaoCyprusCzech RepublicDenmarkDominican RepublicEarly-demographic dividendEast Asia & PacificEast Asia & Pacific (excluding high income)East Asia & Pacific (IDA & IBRD countries)EcuadorEgypt, Arab Rep.El SalvadorEritreaEstoniaEthiopiaEuro areaEurope & Central AsiaEurope & Central Asia (excluding high income)Europe & Central Asia (IDA & IBRD countries)European UnionFinlandFragile and conflict affected situationsFranceGabonGeorgiaGermanyGhanaGibraltarGreeceGuatemalaHaitiHeavily indebted poor countries (HIPC)High incomeHondurasHong Kong SAR, ChinaHungaryIBRD onlyIcelandIDA & IBRD totalIDA blendIDA onlyIDA totalIndiaIndonesiaIran, Islamic Rep.IraqIrelandIsraelItalyJamaicaJapanJordanKazakhstanKenyaKorea, Dem. People’s Rep.Korea, Rep.KosovoKuwaitKyrgyz RepublicLate-demographic dividendLatin America & Caribbean Latin America & Caribbean (excluding high income)Latin America & the Caribbean (IDA & IBRD countries)LatviaLeast developed countries: UN classificationLebanonLibyaLithuaniaLow & middle incomeLow incomeLower middle incomeLuxembourgMacedonia, FYRMalaysiaMaltaMauritiusMexicoMiddle East & North AfricaMiddle East & North Africa (excluding high income)Middle East & North Africa (IDA & IBRD countries)Middle incomeMoldovaMongoliaMontenegroMoroccoMozambiqueMyanmarNamibiaNepalNetherlandsNew ZealandNicaraguaNigerNigeriaNorth AmericaNorwayOECD membersOmanOther small statesPakistanPanamaParaguayPeruPhilippinesPolandPortugalPost-demographic dividendPre-demographic dividendQatarRomaniaRussian FederationSaudi ArabiaSenegalSerbiaSingaporeSlovak RepublicSloveniaSmall statesSouth AfricaSouth AsiaSouth Asia (IDA & IBRD)South SudanSpainSri LankaSub-Saharan Africa Sub-Saharan Africa (excluding high income)Sub-Saharan Africa (IDA & IBRD countries)SudanSwedenSwitzerlandSyrian Arab RepublicTajikistanTanzaniaThailandTogoTrinidad and TobagoTunisiaTurkeyTurkmenistanUkraineUnited Arab EmiratesUnited KingdomUnited StatesUpper middle incomeUruguayUzbekistanVenezuela, RBVietnamWorldYemen, Rep.ZambiaZimbabwe Linha do tempo:
Nesta escala de tempo está apresentado um gráfico de 1972 ano até 2014 ano Ecuador. Dados de 1971 ano ausente. O número de observações reais por data: 43.
Fonte (nome):
Indicadores de desenvolvimento mundial
Fonte (organização):
IEA Statistics © OECD/IEA 2014 (http://www.iea.org/stats/index.asp), subject to https://www.iea.org/t&c/termsandconditions/
Categorias:
Energy & Mining
Foi atualizado:
23 abr 2017 ano
Indicadores de alterações dos valores ao longo dos anos
Mínimo:
1.146
1 jan 1978 ano
Na data de observação
Valor
Mudança absoluta
A alteração em relação ao valor anterior
1 jan 1972 ano
1.692
+1.692
0.0%
1 jan 1973 ano
1.651
-0.041
-2.41%
1 jan 1974 ano
1.591
-0.06
-3.64%
1 jan 1975 ano
1.509
-0.082
-5.13%
1 jan 1976 ano
1.719
+0.21
13.9%
1 jan 1977 ano
1.489
-0.23
-13.39%
1 jan 1978 ano
1.146
-0.343
-23.05%
1 jan 1979 ano
1.577
+0.431
37.63%
1 jan 1980 ano
1.339
-0.238
-15.1%
1 jan 1981 ano
1.501
+0.162
12.13%
1 jan 1982 ano
1.289
-0.212
-14.12%
1 jan 1983 ano
1.376
+0.087
6.72%
1 jan 1984 ano
2.853
+1.478
107.4%
1 jan 1985 ano
5.006
+2.152
75.44%
1 jan 1986 ano
5.022
+0.016
0.32%
1 jan 1987 ano
6.17
+1.149
22.87%
1 jan 1988 ano
6.864
+0.693
11.24%
1 jan 1989 ano
6.921
+0.057
0.84%
1 jan 1990 ano
7.431
+0.51
7.37%
1 jan 1991 ano
6.775
-0.656
-8.82%
1 jan 1992 ano
6.56
-0.215
-3.18%
1 jan 1993 ano
6.35
-0.21
-3.2%
1 jan 1994 ano
7.956
+1.606
25.29%
1 jan 1995 ano
8.4
+0.444
5.59%
1 jan 1996 ano
5.659
-2.741
-32.63%
1 jan 1997 ano
6.601
+0.942
16.65%
1 jan 1998 ano
6.549
-0.052
-0.79%
1 jan 1999 ano
6.348
-0.202
-3.08%
1 jan 2000 ano
7.781
+1.434
22.58%
1 jan 2001 ano
7.445
-0.336
-4.32%
1 jan 2002 ano
6.523
-0.923
-12.39%
1 jan 2003 ano
6.717
+0.195
2.99%
1 jan 2004 ano
6.509
-0.208
-3.1%
1 jan 2005 ano
6.192
-0.317
-4.87%
1 jan 2006 ano
5.849
-0.343
-5.54%
1 jan 2007 ano
5.602
-0.247
-4.23%
1 jan 2008 ano
6.588
+0.986
17.59%
1 jan 2009 ano
7.891
+1.304
19.79%
1 jan 2010 ano
6.046
-1.845
-23.38%
1 jan 2011 ano
5.428
-0.618
-10.22%
1 jan 2012 ano
6.77
+1.342
24.72%
1 jan 2013 ano
7.25
+0.48
7.09%
1 jan 2014 ano
6.236
-1.014
-13.99%
Classificação de países por estatísticas atuais por anos


Comentários: