29
/pt/
pt
AIzaSyAYiBZKx7MnpbEhh9jyipgxe19OcubqV5w
April 1, 2024
223178
Philippines
PHL
true
2
1
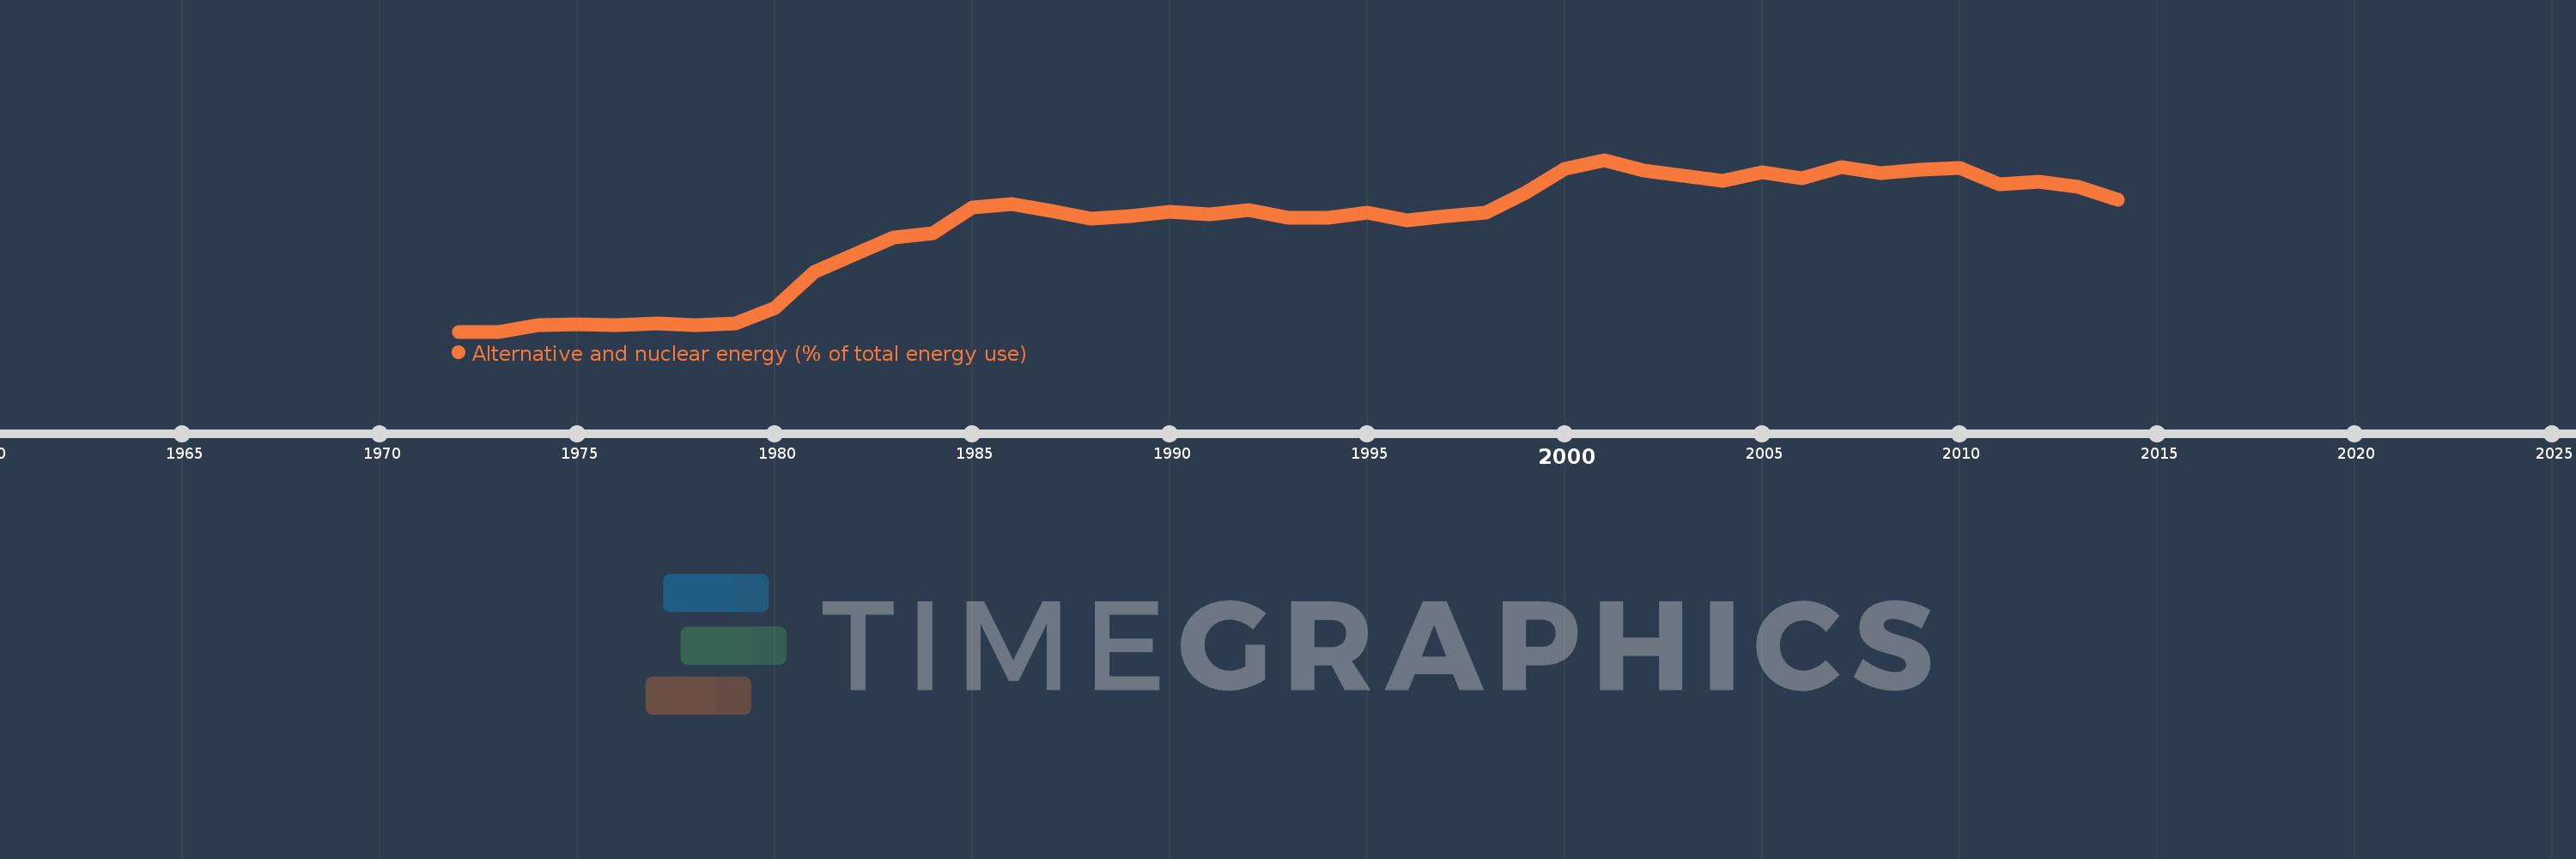
Alternative and nuclear energy (% of total energy use)
2014,2013,2012,2011,2010,2009,2008,2007,2006,2005,2004,2003,2002,2001,2000,1999,1998,1997,1996,1995,1994,1993,1992,1991,1990,1989,1988,1987,1986,1985,1984,1983,1982,1981,1980,1979,1978,1977,1976,1975,1974,1973,1972
Estas estatísticas em outros países:
AlbaniaAlgeriaAngolaArab WorldArgentinaArmeniaAustraliaAustriaAzerbaijanBahrainBangladeshBelarusBelgiumBeninBoliviaBosnia and HerzegovinaBotswanaBrazilBrunei DarussalamBulgariaCambodiaCameroonCanadaCaribbean small statesCentral Europe and the BalticsChileChinaColombiaCongo, Dem. Rep.Congo, Rep.Costa RicaCote d'IvoireCroatiaCubaCuracaoCyprusCzech RepublicDenmarkDominican RepublicEarly-demographic dividendEast Asia & PacificEast Asia & Pacific (excluding high income)East Asia & Pacific (IDA & IBRD countries)EcuadorEgypt, Arab Rep.El SalvadorEritreaEstoniaEthiopiaEuro areaEurope & Central AsiaEurope & Central Asia (excluding high income)Europe & Central Asia (IDA & IBRD countries)European UnionFinlandFragile and conflict affected situationsFranceGabonGeorgiaGermanyGhanaGibraltarGreeceGuatemalaHaitiHeavily indebted poor countries (HIPC)High incomeHondurasHong Kong SAR, ChinaHungaryIBRD onlyIcelandIDA & IBRD totalIDA blendIDA onlyIDA totalIndiaIndonesiaIran, Islamic Rep.IraqIrelandIsraelItalyJamaicaJapanJordanKazakhstanKenyaKorea, Dem. People’s Rep.Korea, Rep.KosovoKuwaitKyrgyz RepublicLate-demographic dividendLatin America & Caribbean Latin America & Caribbean (excluding high income)Latin America & the Caribbean (IDA & IBRD countries)LatviaLeast developed countries: UN classificationLebanonLibyaLithuaniaLow & middle incomeLow incomeLower middle incomeLuxembourgMacedonia, FYRMalaysiaMaltaMauritiusMexicoMiddle East & North AfricaMiddle East & North Africa (excluding high income)Middle East & North Africa (IDA & IBRD countries)Middle incomeMoldovaMongoliaMontenegroMoroccoMozambiqueMyanmarNamibiaNepalNetherlandsNew ZealandNicaraguaNigerNigeriaNorth AmericaNorwayOECD membersOmanOther small statesPakistanPanamaParaguayPeruPhilippinesPolandPortugalPost-demographic dividendPre-demographic dividendQatarRomaniaRussian FederationSaudi ArabiaSenegalSerbiaSingaporeSlovak RepublicSloveniaSmall statesSouth AfricaSouth AsiaSouth Asia (IDA & IBRD)South SudanSpainSri LankaSub-Saharan Africa Sub-Saharan Africa (excluding high income)Sub-Saharan Africa (IDA & IBRD countries)SudanSwedenSwitzerlandSyrian Arab RepublicTajikistanTanzaniaThailandTogoTrinidad and TobagoTunisiaTurkeyTurkmenistanUkraineUnited Arab EmiratesUnited KingdomUnited StatesUpper middle incomeUruguayUzbekistanVenezuela, RBVietnamWorldYemen, Rep.ZambiaZimbabwe Linha do tempo:
Nesta escala de tempo está apresentado um gráfico de 1972 ano até 2014 ano Philippines. Dados de 1971 ano ausente. O número de observações reais por data: 43.
Fonte (nome):
Indicadores de desenvolvimento mundial
Fonte (organização):
IEA Statistics © OECD/IEA 2014 (http://www.iea.org/stats/index.asp), subject to https://www.iea.org/t&c/termsandconditions/
Categorias:
Energy & Mining
Foi atualizado:
23 abr 2017 ano
Indicadores de alterações dos valores ao longo dos anos
Máximo:
26.67
1 jan 2001 ano
Na data de observação
Valor
Mudança absoluta
A alteração em relação ao valor anterior
1 jan 1972 ano
0.0
0.0
0.0%
1 jan 1974 ano
0.939
+0.939
%
1 jan 1975 ano
1.179
+0.24
25.52%
1 jan 1976 ano
1.06
-0.119
-10.09%
1 jan 1977 ano
1.256
+0.196
18.48%
1 jan 1978 ano
0.948
-0.308
-24.53%
1 jan 1979 ano
1.203
+0.256
26.97%
1 jan 1980 ano
3.704
+2.501
207.87%
1 jan 1981 ano
9.318
+5.613
151.52%
1 jan 1982 ano
11.994
+2.676
28.72%
1 jan 1983 ano
14.562
+2.568
21.41%
1 jan 1984 ano
15.291
+0.729
5.0%
1 jan 1985 ano
19.231
+3.94
25.76%
1 jan 1986 ano
19.842
+0.612
3.18%
1 jan 1987 ano
18.735
-1.107
-5.58%
1 jan 1988 ano
17.503
-1.232
-6.57%
1 jan 1989 ano
17.902
+0.399
2.28%
1 jan 1990 ano
18.563
+0.661
3.69%
1 jan 1991 ano
18.184
-0.379
-2.04%
1 jan 1992 ano
18.81
+0.627
3.45%
1 jan 1993 ano
17.623
-1.187
-6.31%
1 jan 1994 ano
17.711
+0.088
0.5%
1 jan 1995 ano
18.5
+0.789
4.45%
1 jan 1996 ano
17.281
-1.219
-6.59%
1 jan 1997 ano
17.893
+0.613
3.55%
1 jan 1998 ano
18.428
+0.534
2.99%
1 jan 1999 ano
21.513
+3.085
16.74%
1 jan 2000 ano
25.313
+3.799
17.66%
1 jan 2001 ano
26.67
+1.357
5.36%
1 jan 2002 ano
25.039
-1.631
-6.12%
1 jan 2003 ano
24.243
-0.796
-3.18%
1 jan 2004 ano
23.438
-0.805
-3.32%
1 jan 2005 ano
24.693
+1.255
5.35%
1 jan 2006 ano
23.77
-0.923
-3.74%
1 jan 2007 ano
25.554
+1.784
7.5%
1 jan 2008 ano
24.641
-0.912
-3.57%
1 jan 2009 ano
25.109
+0.468
1.9%
1 jan 2010 ano
25.461
+0.352
1.4%
1 jan 2011 ano
22.804
-2.657
-10.43%
1 jan 2012 ano
23.269
+0.465
2.04%
1 jan 2013 ano
22.53
-0.739
-3.18%
1 jan 2014 ano
20.457
-2.073
-9.2%
Classificação de países por estatísticas atuais por anos


Comentários: