29
/pt/
pt
AIzaSyAYiBZKx7MnpbEhh9jyipgxe19OcubqV5w
April 1, 2024
30469
Europe & Central Asia
ECS
false
2
1
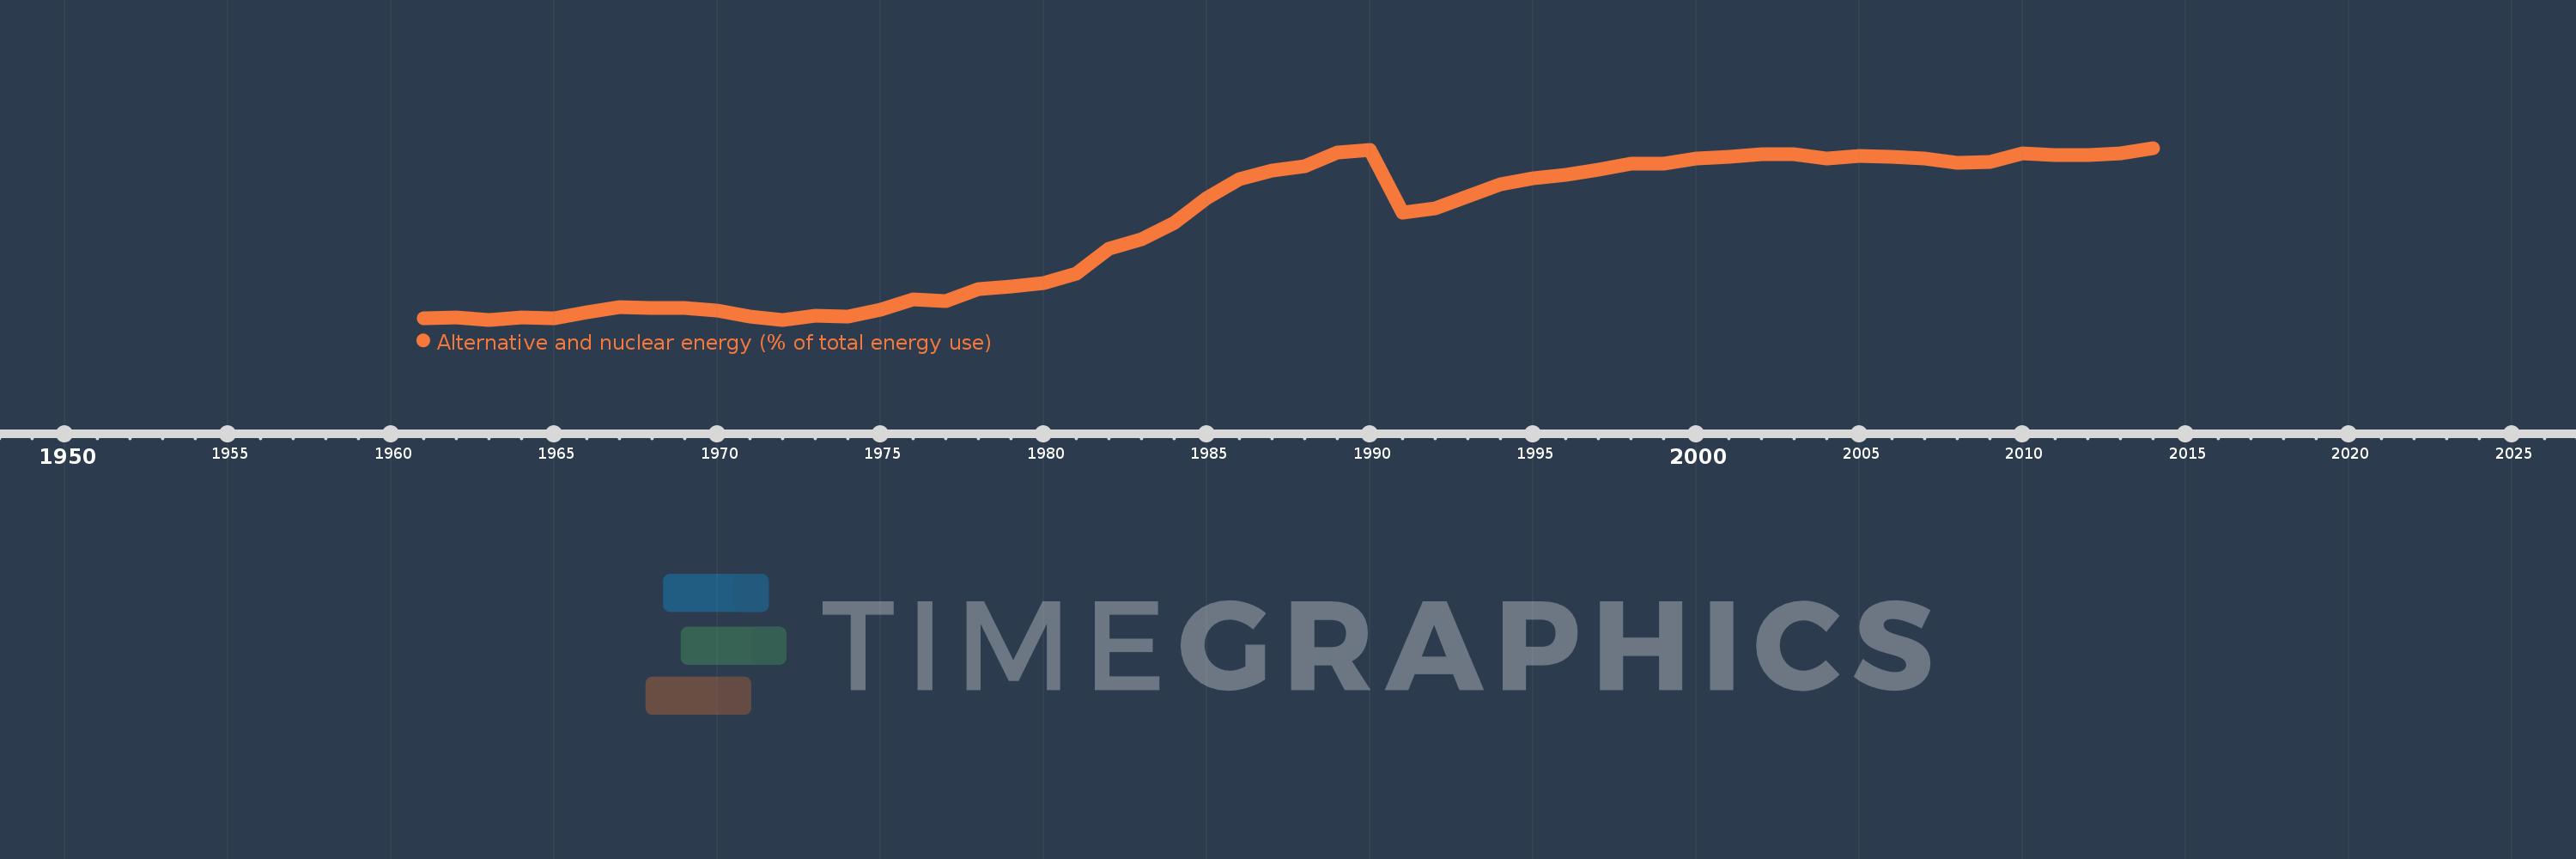
Alternative and nuclear energy (% of total energy use)
2014,2013,2012,2011,2010,2009,2008,2007,2006,2005,2004,2003,2002,2001,2000,1999,1998,1997,1996,1995,1994,1993,1992,1991,1990,1989,1988,1987,1986,1985,1984,1983,1982,1981,1980,1979,1978,1977,1976,1975,1974,1973,1972,1971,1970,1969,1968,1967,1966,1965,1964,1963,1962,1961
Estas estatísticas em outros países:
AlbaniaAlgeriaAngolaArab WorldArgentinaArmeniaAustraliaAustriaAzerbaijanBahrainBangladeshBelarusBelgiumBeninBoliviaBosnia and HerzegovinaBotswanaBrazilBrunei DarussalamBulgariaCambodiaCameroonCanadaCaribbean small statesCentral Europe and the BalticsChileChinaColombiaCongo, Dem. Rep.Congo, Rep.Costa RicaCote d'IvoireCroatiaCubaCuracaoCyprusCzech RepublicDenmarkDominican RepublicEarly-demographic dividendEast Asia & PacificEast Asia & Pacific (excluding high income)East Asia & Pacific (IDA & IBRD countries)EcuadorEgypt, Arab Rep.El SalvadorEritreaEstoniaEthiopiaEuro areaEurope & Central AsiaEurope & Central Asia (excluding high income)Europe & Central Asia (IDA & IBRD countries)European UnionFinlandFragile and conflict affected situationsFranceGabonGeorgiaGermanyGhanaGibraltarGreeceGuatemalaHaitiHeavily indebted poor countries (HIPC)High incomeHondurasHong Kong SAR, ChinaHungaryIBRD onlyIcelandIDA & IBRD totalIDA blendIDA onlyIDA totalIndiaIndonesiaIran, Islamic Rep.IraqIrelandIsraelItalyJamaicaJapanJordanKazakhstanKenyaKorea, Dem. People’s Rep.Korea, Rep.KosovoKuwaitKyrgyz RepublicLate-demographic dividendLatin America & Caribbean Latin America & Caribbean (excluding high income)Latin America & the Caribbean (IDA & IBRD countries)LatviaLeast developed countries: UN classificationLebanonLibyaLithuaniaLow & middle incomeLow incomeLower middle incomeLuxembourgMacedonia, FYRMalaysiaMaltaMauritiusMexicoMiddle East & North AfricaMiddle East & North Africa (excluding high income)Middle East & North Africa (IDA & IBRD countries)Middle incomeMoldovaMongoliaMontenegroMoroccoMozambiqueMyanmarNamibiaNepalNetherlandsNew ZealandNicaraguaNigerNigeriaNorth AmericaNorwayOECD membersOmanOther small statesPakistanPanamaParaguayPeruPhilippinesPolandPortugalPost-demographic dividendPre-demographic dividendQatarRomaniaRussian FederationSaudi ArabiaSenegalSerbiaSingaporeSlovak RepublicSloveniaSmall statesSouth AfricaSouth AsiaSouth Asia (IDA & IBRD)South SudanSpainSri LankaSub-Saharan Africa Sub-Saharan Africa (excluding high income)Sub-Saharan Africa (IDA & IBRD countries)SudanSwedenSwitzerlandSyrian Arab RepublicTajikistanTanzaniaThailandTogoTrinidad and TobagoTunisiaTurkeyTurkmenistanUkraineUnited Arab EmiratesUnited KingdomUnited StatesUpper middle incomeUruguayUzbekistanVenezuela, RBVietnamWorldYemen, Rep.ZambiaZimbabwe Linha do tempo:
Nesta escala de tempo está apresentado um gráfico de 1961 ano até 2014 ano Europe & Central Asia. Dados de 1960 ano ausente. O número de observações reais por data: 54.
Fonte (nome):
Indicadores de desenvolvimento mundial
Fonte (organização):
IEA Statistics © OECD/IEA 2014 (http://www.iea.org/stats/index.asp), subject to https://www.iea.org/t&c/termsandconditions/
Categorias:
Energy & Mining
Foi atualizado:
23 abr 2017 ano
Indicadores de alterações dos valores ao longo dos anos
Mínimo:
3.387
1 jan 1963 ano
Máximo:
14.75
1 jan 2014 ano
Na data de observação
Valor
Mudança absoluta
A alteração em relação ao valor anterior
1 jan 1961 ano
3.501
+3.501
0.0%
1 jan 1962 ano
3.529
+0.028
0.81%
1 jan 1963 ano
3.387
-0.142
-4.03%
1 jan 1964 ano
3.527
+0.139
4.11%
1 jan 1965 ano
3.474
-0.053
-1.5%
1 jan 1966 ano
3.906
+0.432
12.43%
1 jan 1967 ano
4.21
+0.305
7.8%
1 jan 1968 ano
4.192
-0.018
-0.43%
1 jan 1969 ano
4.149
-0.043
-1.04%
1 jan 1970 ano
3.991
-0.158
-3.8%
1 jan 1971 ano
3.619
-0.372
-9.31%
1 jan 1972 ano
3.397
-0.223
-6.16%
1 jan 1973 ano
3.661
+0.264
7.77%
1 jan 1974 ano
3.621
-0.04
-1.09%
1 jan 1975 ano
4.045
+0.425
11.72%
1 jan 1976 ano
4.736
+0.691
17.08%
1 jan 1977 ano
4.595
-0.141
-2.98%
1 jan 1978 ano
5.43
+0.835
18.17%
1 jan 1979 ano
5.566
+0.136
2.5%
1 jan 1980 ano
5.827
+0.261
4.69%
1 jan 1981 ano
6.416
+0.589
10.11%
1 jan 1982 ano
8.076
+1.661
25.88%
1 jan 1983 ano
8.714
+0.638
7.9%
1 jan 1984 ano
9.794
+1.081
12.4%
1 jan 1985 ano
11.461
+1.667
17.02%
1 jan 1986 ano
12.706
+1.245
10.86%
1 jan 1987 ano
13.232
+0.526
4.14%
1 jan 1988 ano
13.525
+0.293
2.21%
1 jan 1989 ano
14.422
+0.897
6.64%
1 jan 1990 ano
14.647
+0.225
1.56%
1 jan 1991 ano
10.495
-4.153
-28.35%
1 jan 1992 ano
10.77
+0.276
2.63%
1 jan 1993 ano
11.523
+0.752
6.99%
1 jan 1994 ano
12.325
+0.802
6.96%
1 jan 1995 ano
12.757
+0.432
3.51%
1 jan 1996 ano
12.947
+0.19
1.49%
1 jan 1997 ano
13.308
+0.36
2.78%
1 jan 1998 ano
13.716
+0.408
3.07%
1 jan 1999 ano
13.737
+0.021
0.16%
1 jan 2000 ano
14.032
+0.294
2.14%
1 jan 2001 ano
14.147
+0.116
0.82%
1 jan 2002 ano
14.328
+0.181
1.28%
1 jan 2003 ano
14.332
+0.003
0.02%
1 jan 2004 ano
14.053
-0.279
-1.95%
1 jan 2005 ano
14.226
+0.174
1.24%
1 jan 2006 ano
14.163
-0.063
-0.44%
1 jan 2007 ano
14.034
-0.129
-0.91%
1 jan 2008 ano
13.789
-0.245
-1.75%
1 jan 2009 ano
13.851
+0.062
0.45%
1 jan 2010 ano
14.409
+0.558
4.03%
1 jan 2011 ano
14.279
-0.129
-0.9%
1 jan 2012 ano
14.276
-0.004
-0.03%
1 jan 2013 ano
14.407
+0.131
0.92%
1 jan 2014 ano
14.75
+0.343
2.38%
Classificação de países por estatísticas atuais por anos


Comentários: