29
/pt/
pt
AIzaSyAYiBZKx7MnpbEhh9jyipgxe19OcubqV5w
April 1, 2024
214045
Norway
NOR
true
2
1
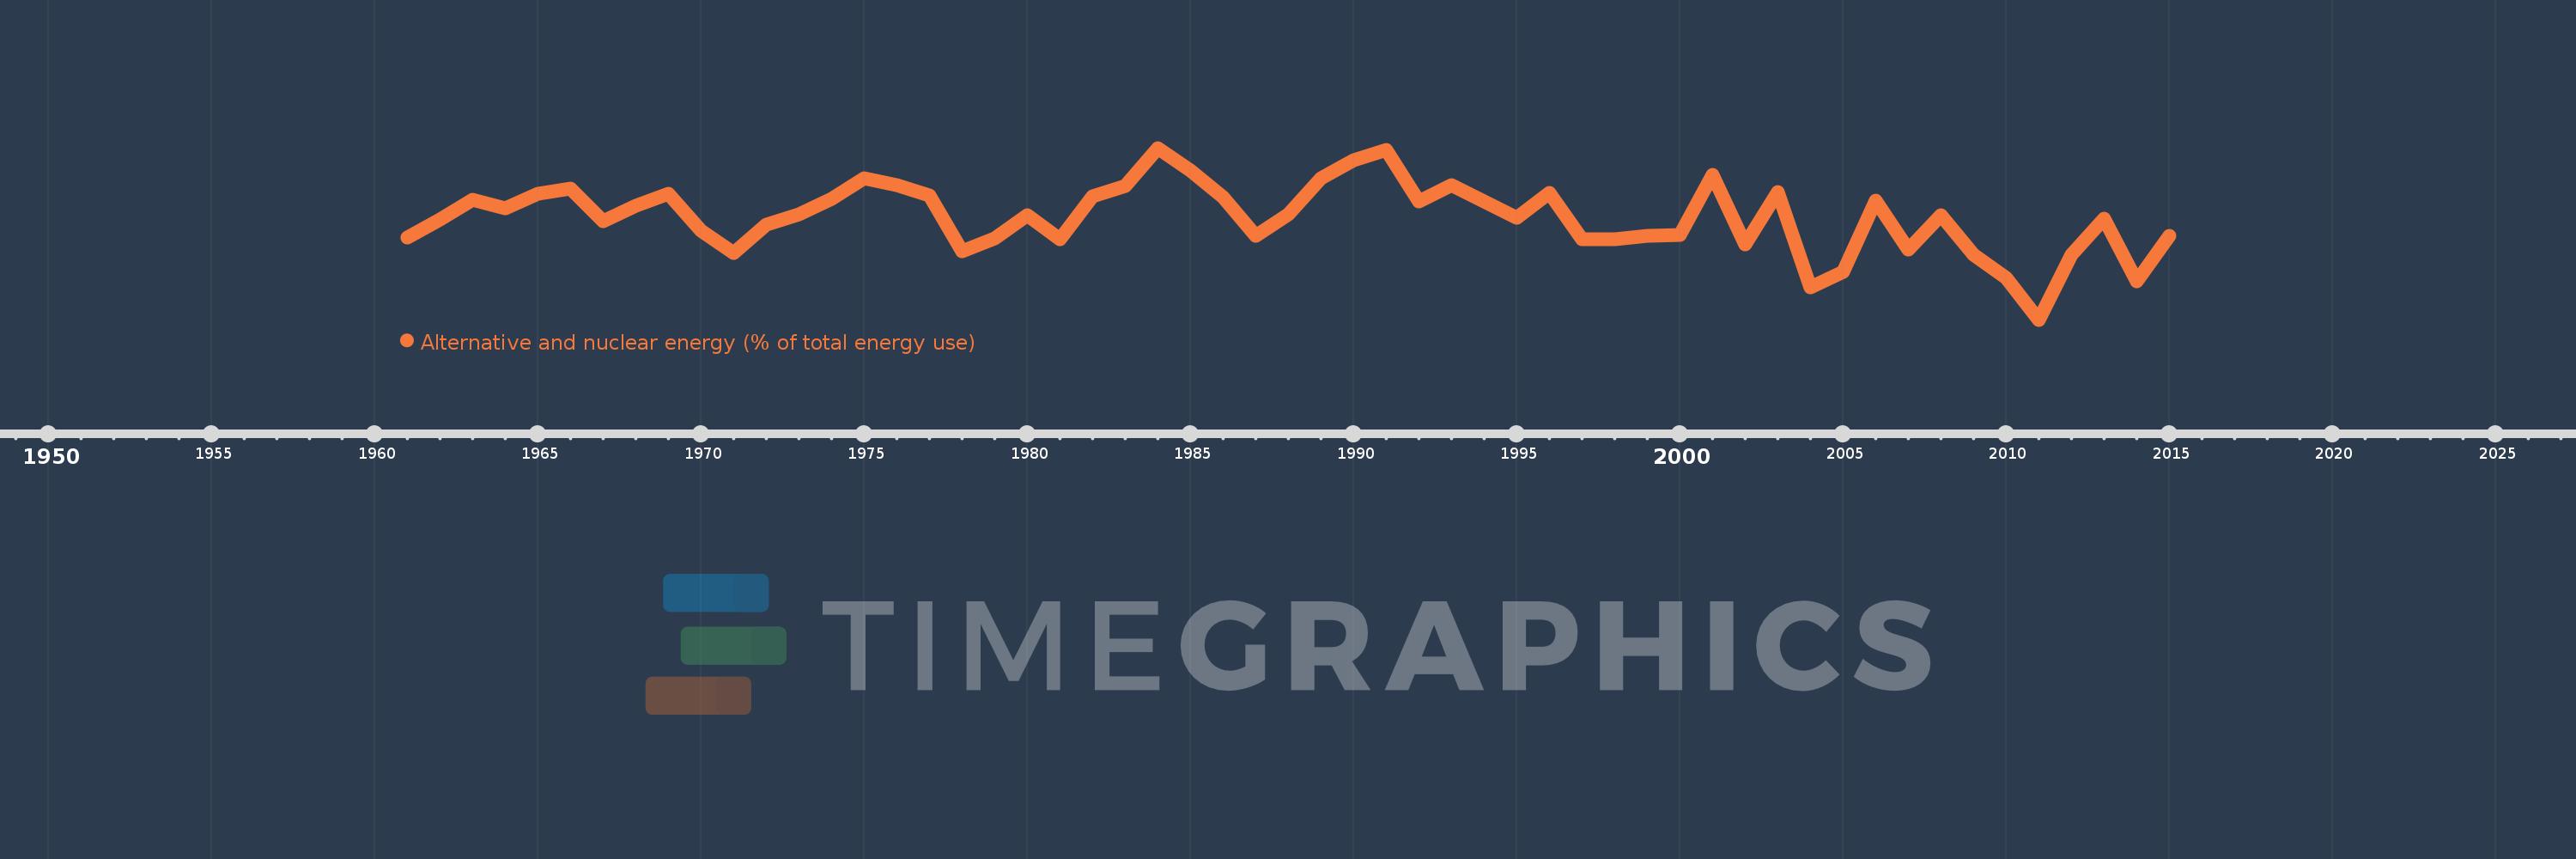
Alternative and nuclear energy (% of total energy use)
2015,2014,2013,2012,2011,2010,2009,2008,2007,2006,2005,2004,2003,2002,2001,2000,1999,1998,1997,1996,1995,1994,1993,1992,1991,1990,1989,1988,1987,1986,1985,1984,1983,1982,1981,1980,1979,1978,1977,1976,1975,1974,1973,1972,1971,1970,1969,1968,1967,1966,1965,1964,1963,1962,1961
Estas estatísticas em outros países:
AlbaniaAlgeriaAngolaArab WorldArgentinaArmeniaAustraliaAustriaAzerbaijanBahrainBangladeshBelarusBelgiumBeninBoliviaBosnia and HerzegovinaBotswanaBrazilBrunei DarussalamBulgariaCambodiaCameroonCanadaCaribbean small statesCentral Europe and the BalticsChileChinaColombiaCongo, Dem. Rep.Congo, Rep.Costa RicaCote d'IvoireCroatiaCubaCuracaoCyprusCzech RepublicDenmarkDominican RepublicEarly-demographic dividendEast Asia & PacificEast Asia & Pacific (excluding high income)East Asia & Pacific (IDA & IBRD countries)EcuadorEgypt, Arab Rep.El SalvadorEritreaEstoniaEthiopiaEuro areaEurope & Central AsiaEurope & Central Asia (excluding high income)Europe & Central Asia (IDA & IBRD countries)European UnionFinlandFragile and conflict affected situationsFranceGabonGeorgiaGermanyGhanaGibraltarGreeceGuatemalaHaitiHeavily indebted poor countries (HIPC)High incomeHondurasHong Kong SAR, ChinaHungaryIBRD onlyIcelandIDA & IBRD totalIDA blendIDA onlyIDA totalIndiaIndonesiaIran, Islamic Rep.IraqIrelandIsraelItalyJamaicaJapanJordanKazakhstanKenyaKorea, Dem. People’s Rep.Korea, Rep.KosovoKuwaitKyrgyz RepublicLate-demographic dividendLatin America & Caribbean Latin America & Caribbean (excluding high income)Latin America & the Caribbean (IDA & IBRD countries)LatviaLeast developed countries: UN classificationLebanonLibyaLithuaniaLow & middle incomeLow incomeLower middle incomeLuxembourgMacedonia, FYRMalaysiaMaltaMauritiusMexicoMiddle East & North AfricaMiddle East & North Africa (excluding high income)Middle East & North Africa (IDA & IBRD countries)Middle incomeMoldovaMongoliaMontenegroMoroccoMozambiqueMyanmarNamibiaNepalNetherlandsNew ZealandNicaraguaNigerNigeriaNorth AmericaNorwayOECD membersOmanOther small statesPakistanPanamaParaguayPeruPhilippinesPolandPortugalPost-demographic dividendPre-demographic dividendQatarRomaniaRussian FederationSaudi ArabiaSenegalSerbiaSingaporeSlovak RepublicSloveniaSmall statesSouth AfricaSouth AsiaSouth Asia (IDA & IBRD)South SudanSpainSri LankaSub-Saharan Africa Sub-Saharan Africa (excluding high income)Sub-Saharan Africa (IDA & IBRD countries)SudanSwedenSwitzerlandSyrian Arab RepublicTajikistanTanzaniaThailandTogoTrinidad and TobagoTunisiaTurkeyTurkmenistanUkraineUnited Arab EmiratesUnited KingdomUnited StatesUpper middle incomeUruguayUzbekistanVenezuela, RBVietnamWorldYemen, Rep.ZambiaZimbabwe Linha do tempo:
Nesta escala de tempo está apresentado um gráfico de 1961 ano até 2015 ano Norway. Dados de 1960 ano ausente. O número de observações reais por data: 55.
Fonte (nome):
Indicadores de desenvolvimento mundial
Fonte (organização):
IEA Statistics © OECD/IEA 2014 (http://www.iea.org/stats/index.asp), subject to https://www.iea.org/t&c/termsandconditions/
Categorias:
Energy & Mining
Foi atualizado:
23 abr 2017 ano
Indicadores de alterações dos valores ao longo dos anos
Mínimo:
29.816
1 jan 2011 ano
Máximo:
49.722
1 jan 1984 ano
Na data de observação
Valor
Mudança absoluta
A alteração em relação ao valor anterior
1 jan 1961 ano
39.336
+39.336
0.0%
1 jan 1962 ano
41.46
+2.124
5.4%
1 jan 1963 ano
43.766
+2.306
5.56%
1 jan 1964 ano
42.719
-1.046
-2.39%
1 jan 1965 ano
44.453
+1.734
4.06%
1 jan 1966 ano
44.978
+0.525
1.18%
1 jan 1967 ano
41.215
-3.763
-8.37%
1 jan 1968 ano
43.017
+1.801
4.37%
1 jan 1969 ano
44.438
+1.421
3.3%
1 jan 1970 ano
40.151
-4.287
-9.65%
1 jan 1971 ano
37.532
-2.62
-6.52%
1 jan 1972 ano
40.815
+3.283
8.75%
1 jan 1973 ano
42.078
+1.263
3.09%
1 jan 1974 ano
43.852
+1.774
4.22%
1 jan 1975 ano
46.163
+2.312
5.27%
1 jan 1976 ano
45.446
-0.717
-1.55%
1 jan 1977 ano
44.17
-1.277
-2.81%
1 jan 1978 ano
37.731
-6.439
-14.58%
1 jan 1979 ano
39.218
+1.487
3.94%
1 jan 1980 ano
41.929
+2.711
6.91%
1 jan 1981 ano
39.182
-2.747
-6.55%
1 jan 1982 ano
44.109
+4.927
12.58%
1 jan 1983 ano
45.356
+1.247
2.83%
1 jan 1984 ano
49.722
+4.366
9.63%
1 jan 1985 ano
47.085
-2.638
-5.3%
1 jan 1986 ano
44.034
-3.051
-6.48%
1 jan 1987 ano
39.515
-4.519
-10.26%
1 jan 1988 ano
42.017
+2.503
6.33%
1 jan 1989 ano
46.167
+4.15
9.88%
1 jan 1990 ano
48.332
+2.164
4.69%
1 jan 1991 ano
49.454
+1.122
2.32%
1 jan 1992 ano
43.534
-5.92
-11.97%
1 jan 1993 ano
45.368
+1.834
4.21%
1 jan 1994 ano
43.559
-1.809
-3.99%
1 jan 1995 ano
41.657
-1.902
-4.37%
1 jan 1996 ano
44.469
+2.812
6.75%
1 jan 1997 ano
39.186
-5.283
-11.88%
1 jan 1998 ano
39.127
-0.06
-0.15%
1 jan 1999 ano
39.502
+0.376
0.96%
1 jan 2000 ano
39.595
+0.093
0.23%
1 jan 2001 ano
46.624
+7.029
17.75%
1 jan 2002 ano
38.538
-8.086
-17.34%
1 jan 2003 ano
44.573
+6.036
15.66%
1 jan 2004 ano
33.555
-11.018
-24.72%
1 jan 2005 ano
35.385
+1.829
5.45%
1 jan 2006 ano
43.64
+8.255
23.33%
1 jan 2007 ano
37.94
-5.7
-13.06%
1 jan 2008 ano
41.895
+3.956
10.43%
1 jan 2009 ano
37.366
-4.529
-10.81%
1 jan 2010 ano
34.663
-2.703
-7.23%
1 jan 2011 ano
29.816
-4.848
-13.99%
1 jan 2012 ano
37.344
+7.529
25.25%
1 jan 2013 ano
41.55
+4.206
11.26%
1 jan 2014 ano
34.28
-7.269
-17.5%
1 jan 2015 ano
39.502
+5.221
15.23%
Classificação de países por estatísticas atuais por anos


Comentários: