29
/pt/
pt
AIzaSyAYiBZKx7MnpbEhh9jyipgxe19OcubqV5w
April 1, 2024
64079
Afghanistan
AFG
true
2
1
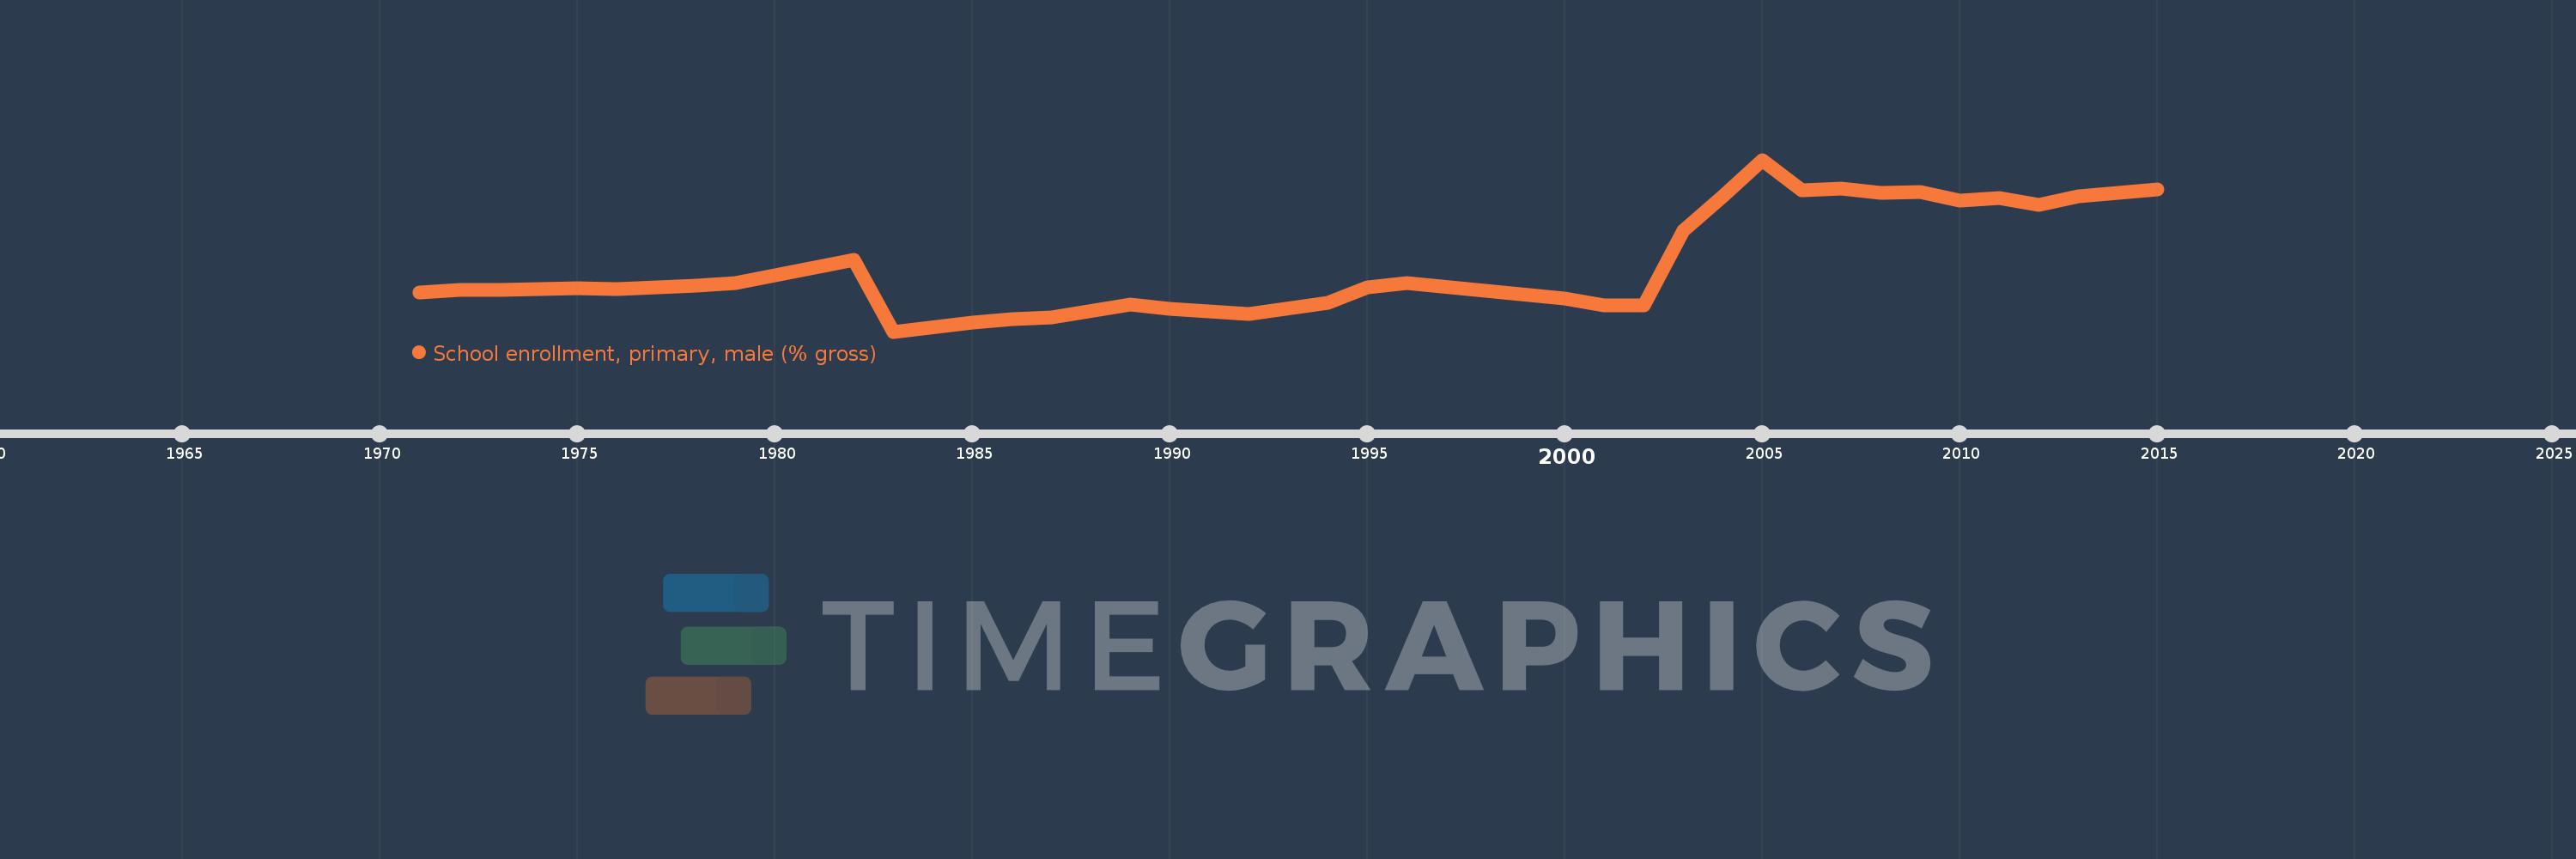
School enrollment, primary, male (% gross)
2015,2014,2013,2012,2011,2010,2009,2008,2007,2006,2005,2004,2003,2002,2001,2000,1996,1995,1994,1992,1991,1990,1989,1987,1986,1985,1983,1982,1981,1979,1978,1977,1976,1975,1974,1973,1972,1971
Estas estatísticas em outros países:
AfghanistanAlbaniaAlgeriaAndorraAngolaAntigua and BarbudaArab WorldArgentinaArmeniaArubaAustraliaAustriaAzerbaijanBahamas, TheBahrainBangladeshBarbadosBelarusBelgiumBelizeBeninBermudaBhutanBoliviaBosnia and HerzegovinaBotswanaBrazilBrunei DarussalamBulgariaBurkina FasoBurundiCabo VerdeCambodiaCameroonCanadaCaribbean small statesCentral African RepublicCentral Europe and the BalticsChadChileChinaColombiaComorosCongo, Dem. Rep.Congo, Rep.Costa RicaCote d'IvoireCroatiaCubaCuracaoCyprusCzech RepublicDenmarkDjiboutiDominicaDominican RepublicEarly-demographic dividendEast Asia & PacificEast Asia & Pacific (excluding high income)East Asia & Pacific (IDA & IBRD countries)EcuadorEgypt, Arab Rep.El SalvadorEquatorial GuineaEritreaEstoniaEthiopiaEuro areaEurope & Central AsiaEurope & Central Asia (excluding high income)Europe & Central Asia (IDA & IBRD countries)European UnionFijiFinlandFragile and conflict affected situationsFranceGabonGambia, TheGeorgiaGermanyGhanaGreeceGrenadaGuatemalaGuineaGuinea-BissauGuyanaHaitiHeavily indebted poor countries (HIPC)High incomeHondurasHong Kong SAR, ChinaHungaryIBRD onlyIcelandIDA & IBRD totalIDA blendIDA onlyIDA totalIndiaIndonesiaIran, Islamic Rep.IraqIrelandIsraelItalyJamaicaJapanJordanKazakhstanKenyaKiribatiKorea, Dem. People’s Rep.Korea, Rep.KuwaitKyrgyz RepublicLao PDRLate-demographic dividendLatin America & Caribbean Latin America & Caribbean (excluding high income)Latin America & the Caribbean (IDA & IBRD countries)LatviaLeast developed countries: UN classificationLebanonLesothoLiberiaLibyaLiechtensteinLithuaniaLow & middle incomeLow incomeLower middle incomeLuxembourgMacao SAR, ChinaMacedonia, FYRMadagascarMalawiMaldivesMaliMaltaMarshall IslandsMauritaniaMauritiusMexicoMicronesia, Fed. Sts.Middle East & North AfricaMiddle East & North Africa (excluding high income)Middle East & North Africa (IDA & IBRD countries)Middle incomeMoldovaMongoliaMontenegroMoroccoMozambiqueMyanmarNamibiaNauruNepalNetherlandsNew ZealandNicaraguaNigerNigeriaNorth AmericaNorwayOECD membersOmanOther small statesPacific island small statesPakistanPalauPanamaPapua New GuineaParaguayPeruPhilippinesPolandPortugalPost-demographic dividendPre-demographic dividendPuerto RicoQatarRomaniaRussian FederationRwandaSamoaSan MarinoSao Tome and PrincipeSaudi ArabiaSenegalSerbiaSeychellesSierra LeoneSlovak RepublicSloveniaSmall statesSolomon IslandsSomaliaSouth AfricaSouth AsiaSouth Asia (IDA & IBRD)South SudanSpainSri LankaSt. Kitts and NevisSt. LuciaSt. Vincent and the GrenadinesSub-Saharan Africa Sub-Saharan Africa (excluding high income)Sub-Saharan Africa (IDA & IBRD countries)SudanSurinameSwazilandSwedenSwitzerlandSyrian Arab RepublicTajikistanTanzaniaThailandTimor-LesteTogoTongaTrinidad and TobagoTunisiaTurkeyTurkmenistanTuvaluUgandaUkraineUnited Arab EmiratesUnited KingdomUnited StatesUpper middle incomeUruguayUzbekistanVanuatuVenezuela, RBVietnamWest Bank and GazaWorldYemen, Rep.ZambiaZimbabwe Linha do tempo:
Nesta escala de tempo está apresentado um gráfico de 1971 ano até 2015 ano Afghanistan. Dados de 1970 ano ausente. O número de observações reais por data: 38.
Fonte (nome):
Indicadores de desenvolvimento mundial
Fonte (organização):
United Nations Educational, Scientific, and Cultural Organization (UNESCO) Institute for Statistics.
Categorias:
Education, Gender
Foi atualizado:
23 abr 2017 ano
Indicadores de alterações dos valores ao longo dos anos
Mínimo:
23.309
1 jan 1983 ano
Máximo:
153.387
1 jan 2005 ano
Na data de observação
Valor
Mudança absoluta
A alteração em relação ao valor anterior
1 jan 1971 ano
52.954
+52.954
0.0%
1 jan 1972 ano
54.621
+1.667
3.15%
1 jan 1973 ano
54.94
+0.32
0.59%
1 jan 1974 ano
55.193
+0.253
0.46%
1 jan 1975 ano
56.185
+0.992
1.8%
1 jan 1976 ano
55.582
-0.603
-1.07%
1 jan 1977 ano
56.919
+1.337
2.4%
1 jan 1978 ano
57.843
+0.924
1.62%
1 jan 1979 ano
59.978
+2.136
3.69%
1 jan 1981 ano
71.766
+11.788
19.65%
1 jan 1982 ano
77.303
+5.537
7.72%
1 jan 1983 ano
23.309
-53.994
-69.85%
1 jan 1985 ano
30.366
+7.057
30.28%
1 jan 1986 ano
32.851
+2.485
8.18%
1 jan 1987 ano
34.22
+1.368
4.17%
1 jan 1989 ano
44.071
+9.851
28.79%
1 jan 1990 ano
40.335
-3.735
-8.48%
1 jan 1991 ano
38.448
-1.887
-4.68%
1 jan 1992 ano
36.673
-1.775
-4.62%
1 jan 1994 ano
45.231
+8.557
23.33%
1 jan 1995 ano
56.607
+11.377
25.15%
1 jan 1996 ano
60.345
+3.737
6.6%
1 jan 2000 ano
48.428
-11.916
-19.75%
1 jan 2001 ano
43.247
-5.181
-10.7%
1 jan 2002 ano
43.095
-0.152
-0.35%
1 jan 2003 ano
99.477
+56.382
130.83%
1 jan 2004 ano
125.898
+26.421
26.56%
1 jan 2005 ano
153.387
+27.489
21.83%
1 jan 2006 ano
130.369
-23.018
-15.01%
1 jan 2007 ano
131.652
+1.283
0.98%
1 jan 2008 ano
128.567
-3.086
-2.34%
1 jan 2009 ano
128.97
+0.403
0.31%
1 jan 2010 ano
122.316
-6.654
-5.16%
1 jan 2011 ano
124.637
+2.321
1.9%
1 jan 2012 ano
119.188
-5.45
-4.37%
1 jan 2013 ano
125.755
+6.568
5.51%
1 jan 2014 ano
128.356
+2.601
2.07%
1 jan 2015 ano
130.688
+2.332
1.82%
Classificação de países por estatísticas atuais por anos


Comentários: