29
/pt/
pt
AIzaSyAYiBZKx7MnpbEhh9jyipgxe19OcubqV5w
April 1, 2024
120454
Djibouti
DJI
true
2
1
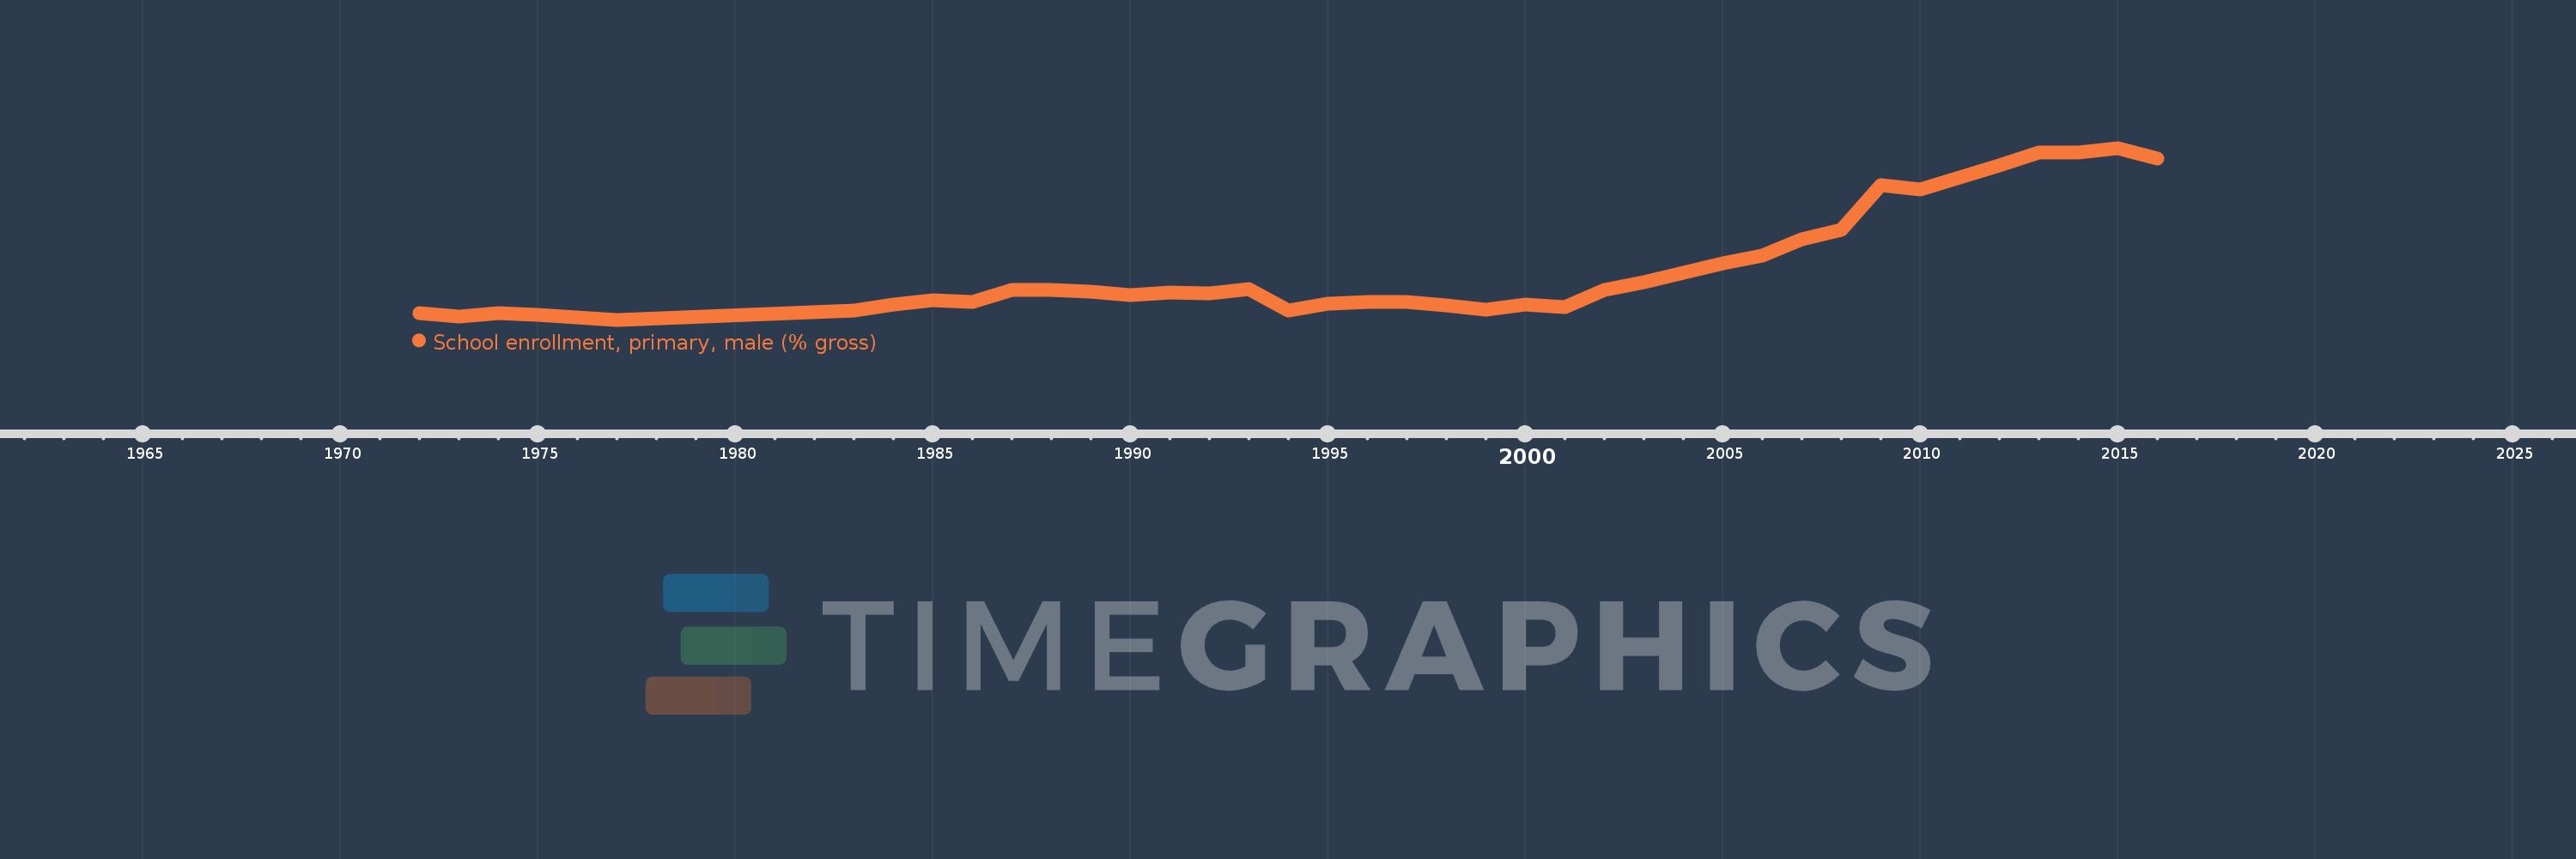
School enrollment, primary, male (% gross)
2016,2015,2014,2013,2012,2010,2009,2008,2007,2006,2005,2003,2002,2001,2000,1999,1998,1997,1996,1995,1994,1993,1992,1991,1990,1989,1988,1987,1986,1985,1984,1983,1977,1976,1975,1974,1973,1972
Estas estatísticas em outros países:
AfghanistanAlbaniaAlgeriaAndorraAngolaAntigua and BarbudaArab WorldArgentinaArmeniaArubaAustraliaAustriaAzerbaijanBahamas, TheBahrainBangladeshBarbadosBelarusBelgiumBelizeBeninBermudaBhutanBoliviaBosnia and HerzegovinaBotswanaBrazilBrunei DarussalamBulgariaBurkina FasoBurundiCabo VerdeCambodiaCameroonCanadaCaribbean small statesCentral African RepublicCentral Europe and the BalticsChadChileChinaColombiaComorosCongo, Dem. Rep.Congo, Rep.Costa RicaCote d'IvoireCroatiaCubaCuracaoCyprusCzech RepublicDenmarkDjiboutiDominicaDominican RepublicEarly-demographic dividendEast Asia & PacificEast Asia & Pacific (excluding high income)East Asia & Pacific (IDA & IBRD countries)EcuadorEgypt, Arab Rep.El SalvadorEquatorial GuineaEritreaEstoniaEthiopiaEuro areaEurope & Central AsiaEurope & Central Asia (excluding high income)Europe & Central Asia (IDA & IBRD countries)European UnionFijiFinlandFragile and conflict affected situationsFranceGabonGambia, TheGeorgiaGermanyGhanaGreeceGrenadaGuatemalaGuineaGuinea-BissauGuyanaHaitiHeavily indebted poor countries (HIPC)High incomeHondurasHong Kong SAR, ChinaHungaryIBRD onlyIcelandIDA & IBRD totalIDA blendIDA onlyIDA totalIndiaIndonesiaIran, Islamic Rep.IraqIrelandIsraelItalyJamaicaJapanJordanKazakhstanKenyaKiribatiKorea, Dem. People’s Rep.Korea, Rep.KuwaitKyrgyz RepublicLao PDRLate-demographic dividendLatin America & Caribbean Latin America & Caribbean (excluding high income)Latin America & the Caribbean (IDA & IBRD countries)LatviaLeast developed countries: UN classificationLebanonLesothoLiberiaLibyaLiechtensteinLithuaniaLow & middle incomeLow incomeLower middle incomeLuxembourgMacao SAR, ChinaMacedonia, FYRMadagascarMalawiMaldivesMaliMaltaMarshall IslandsMauritaniaMauritiusMexicoMicronesia, Fed. Sts.Middle East & North AfricaMiddle East & North Africa (excluding high income)Middle East & North Africa (IDA & IBRD countries)Middle incomeMoldovaMongoliaMontenegroMoroccoMozambiqueMyanmarNamibiaNauruNepalNetherlandsNew ZealandNicaraguaNigerNigeriaNorth AmericaNorwayOECD membersOmanOther small statesPacific island small statesPakistanPalauPanamaPapua New GuineaParaguayPeruPhilippinesPolandPortugalPost-demographic dividendPre-demographic dividendPuerto RicoQatarRomaniaRussian FederationRwandaSamoaSan MarinoSao Tome and PrincipeSaudi ArabiaSenegalSerbiaSeychellesSierra LeoneSlovak RepublicSloveniaSmall statesSolomon IslandsSomaliaSouth AfricaSouth AsiaSouth Asia (IDA & IBRD)South SudanSpainSri LankaSt. Kitts and NevisSt. LuciaSt. Vincent and the GrenadinesSub-Saharan Africa Sub-Saharan Africa (excluding high income)Sub-Saharan Africa (IDA & IBRD countries)SudanSurinameSwazilandSwedenSwitzerlandSyrian Arab RepublicTajikistanTanzaniaThailandTimor-LesteTogoTongaTrinidad and TobagoTunisiaTurkeyTurkmenistanTuvaluUgandaUkraineUnited Arab EmiratesUnited KingdomUnited StatesUpper middle incomeUruguayUzbekistanVanuatuVenezuela, RBVietnamWest Bank and GazaWorldYemen, Rep.ZambiaZimbabwe Linha do tempo:
Nesta escala de tempo está apresentado um gráfico de 1972 ano até 2016 ano Djibouti. Dados de 1971 ano ausente. O número de observações reais por data: 38.
Fonte (nome):
Indicadores de desenvolvimento mundial
Fonte (organização):
United Nations Educational, Scientific, and Cultural Organization (UNESCO) Institute for Statistics.
Categorias:
Education, Gender
Foi atualizado:
23 abr 2017 ano
Indicadores de alterações dos valores ao longo dos anos
Mínimo:
32.737
1 jan 1977 ano
Máximo:
72.528
1 jan 2015 ano
Na data de observação
Valor
Mudança absoluta
A alteração em relação ao valor anterior
1 jan 1972 ano
34.318
+34.318
0.0%
1 jan 1973 ano
33.468
-0.85
-2.48%
1 jan 1974 ano
34.34
+0.872
2.61%
1 jan 1975 ano
33.923
-0.417
-1.22%
1 jan 1976 ano
33.326
-0.597
-1.76%
1 jan 1977 ano
32.737
-0.588
-1.77%
1 jan 1983 ano
34.811
+2.074
6.34%
1 jan 1984 ano
36.264
+1.453
4.17%
1 jan 1985 ano
37.25
+0.985
2.72%
1 jan 1986 ano
36.903
-0.347
-0.93%
1 jan 1987 ano
39.545
+2.642
7.16%
1 jan 1988 ano
39.675
+0.13
0.33%
1 jan 1989 ano
39.341
-0.334
-0.84%
1 jan 1990 ano
38.418
-0.923
-2.35%
1 jan 1991 ano
38.969
+0.551
1.43%
1 jan 1992 ano
38.795
-0.174
-0.45%
1 jan 1993 ano
39.897
+1.102
2.84%
1 jan 1994 ano
34.788
-5.109
-12.8%
1 jan 1995 ano
36.371
+1.583
4.55%
1 jan 1996 ano
36.855
+0.484
1.33%
1 jan 1997 ano
36.844
-0.011
-0.03%
1 jan 1998 ano
35.998
-0.846
-2.3%
1 jan 1999 ano
35.113
-0.885
-2.46%
1 jan 2000 ano
36.263
+1.151
3.28%
1 jan 2001 ano
35.736
-0.527
-1.45%
1 jan 2002 ano
39.737
+4.001
11.2%
1 jan 2003 ano
41.469
+1.731
4.36%
1 jan 2005 ano
45.816
+4.347
10.48%
1 jan 2006 ano
47.559
+1.743
3.81%
1 jan 2007 ano
51.369
+3.809
8.01%
1 jan 2008 ano
53.554
+2.185
4.25%
1 jan 2009 ano
63.828
+10.274
19.18%
1 jan 2010 ano
62.836
-0.991
-1.55%
1 jan 2012 ano
68.581
+5.744
9.14%
1 jan 2013 ano
71.42
+2.839
4.14%
1 jan 2014 ano
71.394
-0.025
-0.04%
1 jan 2015 ano
72.528
+1.134
1.59%
1 jan 2016 ano
70.123
-2.405
-3.32%
Classificação de países por estatísticas atuais por anos


Comentários: