29
/pt/
pt
AIzaSyAYiBZKx7MnpbEhh9jyipgxe19OcubqV5w
April 1, 2024
61173
Sub-Saharan Africa (IDA & IBRD countries)
TSS
false
2
1
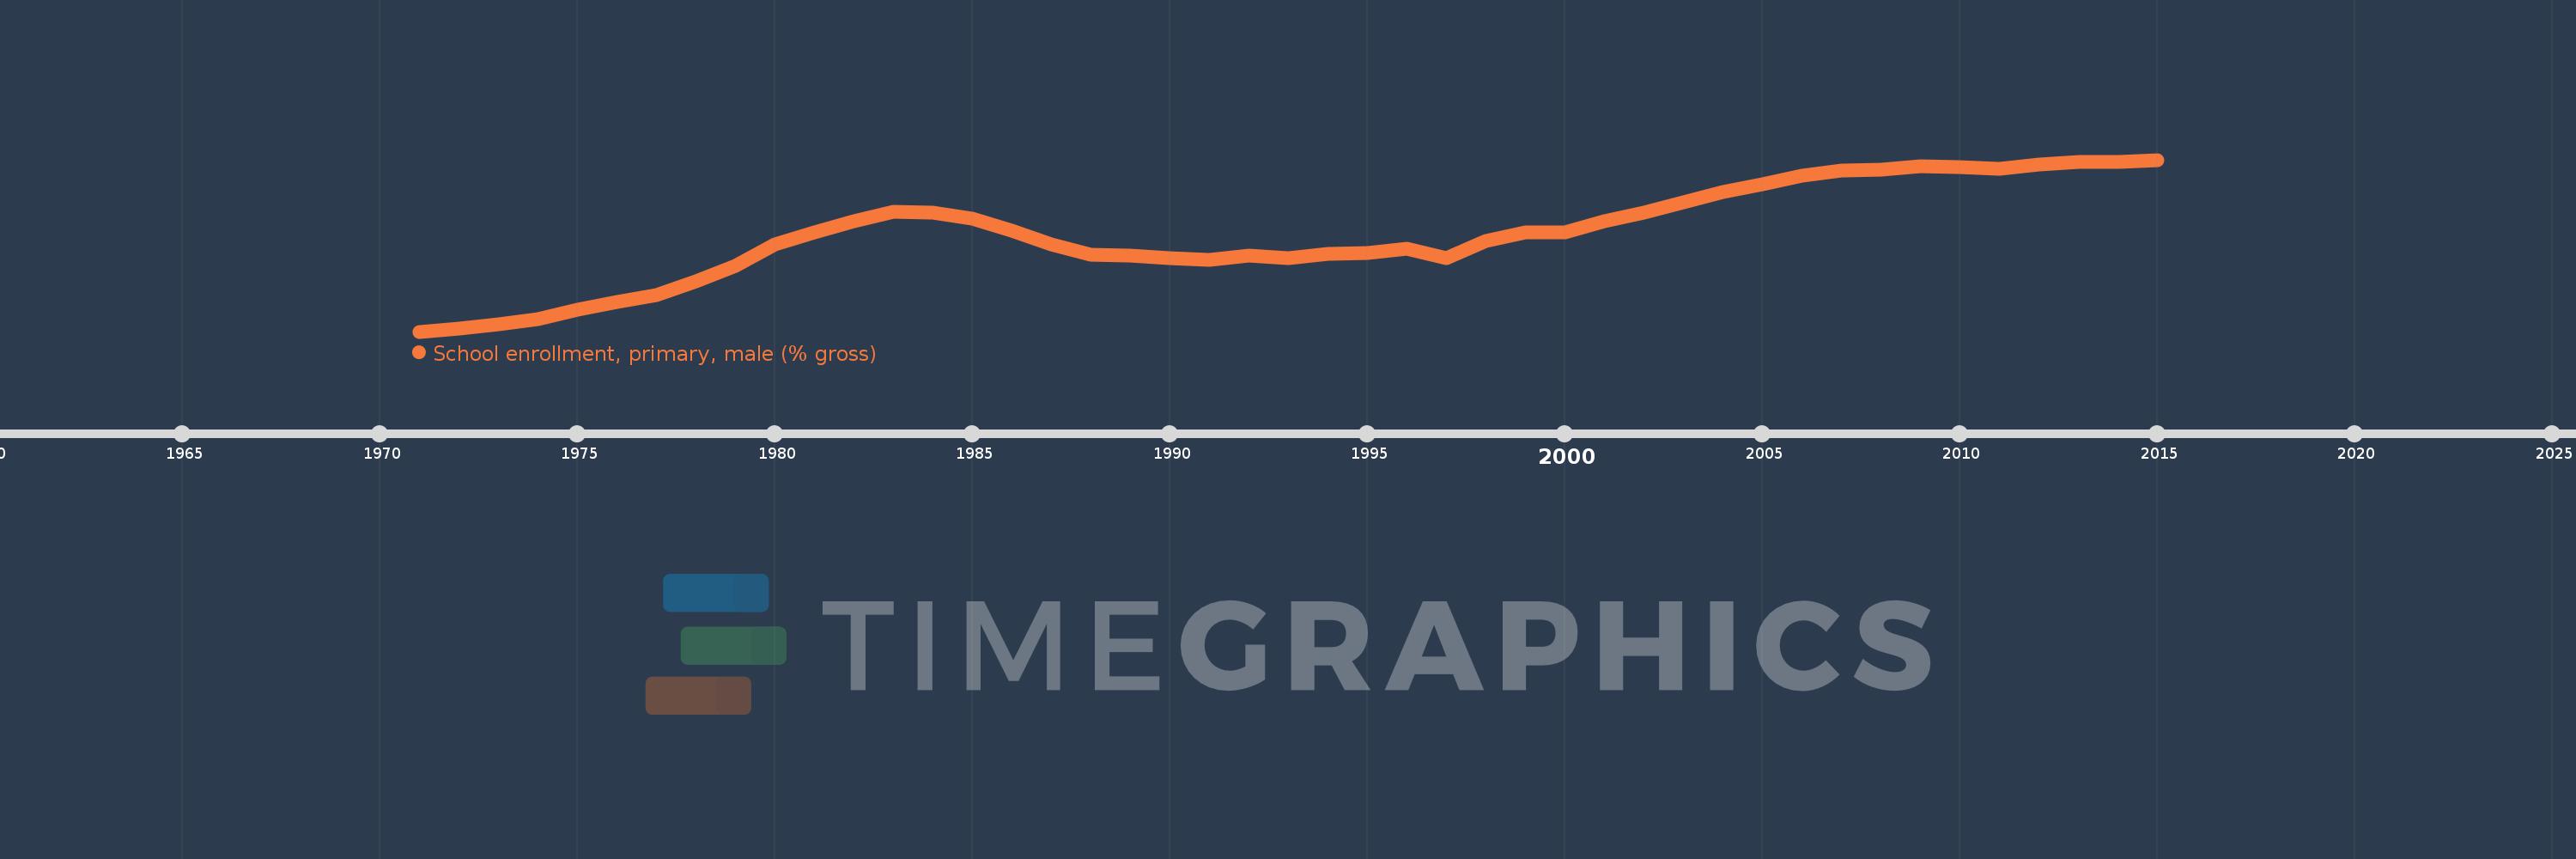
School enrollment, primary, male (% gross)
2015,2014,2013,2012,2011,2010,2009,2008,2007,2006,2005,2004,2003,2002,2001,2000,1999,1998,1997,1996,1995,1994,1993,1992,1991,1990,1989,1988,1987,1986,1985,1984,1983,1982,1981,1980,1979,1978,1977,1976,1975,1974,1973,1972,1971
Estas estatísticas em outros países:
AfghanistanAlbaniaAlgeriaAndorraAngolaAntigua and BarbudaArab WorldArgentinaArmeniaArubaAustraliaAustriaAzerbaijanBahamas, TheBahrainBangladeshBarbadosBelarusBelgiumBelizeBeninBermudaBhutanBoliviaBosnia and HerzegovinaBotswanaBrazilBrunei DarussalamBulgariaBurkina FasoBurundiCabo VerdeCambodiaCameroonCanadaCaribbean small statesCentral African RepublicCentral Europe and the BalticsChadChileChinaColombiaComorosCongo, Dem. Rep.Congo, Rep.Costa RicaCote d'IvoireCroatiaCubaCuracaoCyprusCzech RepublicDenmarkDjiboutiDominicaDominican RepublicEarly-demographic dividendEast Asia & PacificEast Asia & Pacific (excluding high income)East Asia & Pacific (IDA & IBRD countries)EcuadorEgypt, Arab Rep.El SalvadorEquatorial GuineaEritreaEstoniaEthiopiaEuro areaEurope & Central AsiaEurope & Central Asia (excluding high income)Europe & Central Asia (IDA & IBRD countries)European UnionFijiFinlandFragile and conflict affected situationsFranceGabonGambia, TheGeorgiaGermanyGhanaGreeceGrenadaGuatemalaGuineaGuinea-BissauGuyanaHaitiHeavily indebted poor countries (HIPC)High incomeHondurasHong Kong SAR, ChinaHungaryIBRD onlyIcelandIDA & IBRD totalIDA blendIDA onlyIDA totalIndiaIndonesiaIran, Islamic Rep.IraqIrelandIsraelItalyJamaicaJapanJordanKazakhstanKenyaKiribatiKorea, Dem. People’s Rep.Korea, Rep.KuwaitKyrgyz RepublicLao PDRLate-demographic dividendLatin America & Caribbean Latin America & Caribbean (excluding high income)Latin America & the Caribbean (IDA & IBRD countries)LatviaLeast developed countries: UN classificationLebanonLesothoLiberiaLibyaLiechtensteinLithuaniaLow & middle incomeLow incomeLower middle incomeLuxembourgMacao SAR, ChinaMacedonia, FYRMadagascarMalawiMaldivesMaliMaltaMarshall IslandsMauritaniaMauritiusMexicoMicronesia, Fed. Sts.Middle East & North AfricaMiddle East & North Africa (excluding high income)Middle East & North Africa (IDA & IBRD countries)Middle incomeMoldovaMongoliaMontenegroMoroccoMozambiqueMyanmarNamibiaNauruNepalNetherlandsNew ZealandNicaraguaNigerNigeriaNorth AmericaNorwayOECD membersOmanOther small statesPacific island small statesPakistanPalauPanamaPapua New GuineaParaguayPeruPhilippinesPolandPortugalPost-demographic dividendPre-demographic dividendPuerto RicoQatarRomaniaRussian FederationRwandaSamoaSan MarinoSao Tome and PrincipeSaudi ArabiaSenegalSerbiaSeychellesSierra LeoneSlovak RepublicSloveniaSmall statesSolomon IslandsSomaliaSouth AfricaSouth AsiaSouth Asia (IDA & IBRD)South SudanSpainSri LankaSt. Kitts and NevisSt. LuciaSt. Vincent and the GrenadinesSub-Saharan Africa Sub-Saharan Africa (excluding high income)Sub-Saharan Africa (IDA & IBRD countries)SudanSurinameSwazilandSwedenSwitzerlandSyrian Arab RepublicTajikistanTanzaniaThailandTimor-LesteTogoTongaTrinidad and TobagoTunisiaTurkeyTurkmenistanTuvaluUgandaUkraineUnited Arab EmiratesUnited KingdomUnited StatesUpper middle incomeUruguayUzbekistanVanuatuVenezuela, RBVietnamWest Bank and GazaWorldYemen, Rep.ZambiaZimbabwe Linha do tempo:
Nesta escala de tempo está apresentado um gráfico de 1971 ano até 2015 ano Sub-Saharan Africa (IDA & IBRD countries). Dados de 1970 ano ausente. O número de observações reais por data: 45.
Fonte (nome):
Indicadores de desenvolvimento mundial
Fonte (organização):
United Nations Educational, Scientific, and Cultural Organization (UNESCO) Institute for Statistics.
Categorias:
Education, Gender
Foi atualizado:
23 abr 2017 ano
Indicadores de alterações dos valores ao longo dos anos
Mínimo:
62.854
1 jan 1971 ano
Máximo:
102.011
1 jan 2015 ano
Na data de observação
Valor
Mudança absoluta
A alteração em relação ao valor anterior
1 jan 1971 ano
62.854
+62.854
0.0%
1 jan 1972 ano
63.509
+0.655
1.04%
1 jan 1973 ano
64.555
+1.046
1.65%
1 jan 1974 ano
65.677
+1.123
1.74%
1 jan 1975 ano
67.825
+2.148
3.27%
1 jan 1976 ano
69.641
+1.816
2.68%
1 jan 1977 ano
71.094
+1.453
2.09%
1 jan 1978 ano
74.324
+3.23
4.54%
1 jan 1979 ano
77.885
+3.561
4.79%
1 jan 1980 ano
82.66
+4.775
6.13%
1 jan 1981 ano
85.547
+2.887
3.49%
1 jan 1982 ano
88.046
+2.5
2.92%
1 jan 1983 ano
90.136
+2.09
2.37%
1 jan 1984 ano
89.941
-0.195
-0.22%
1 jan 1985 ano
88.547
-1.394
-1.55%
1 jan 1986 ano
85.797
-2.75
-3.11%
1 jan 1987 ano
82.766
-3.031
-3.53%
1 jan 1988 ano
80.466
-2.3
-2.78%
1 jan 1989 ano
80.138
-0.328
-0.41%
1 jan 1990 ano
79.675
-0.463
-0.58%
1 jan 1991 ano
79.231
-0.444
-0.56%
1 jan 1992 ano
80.161
+0.929
1.17%
1 jan 1993 ano
79.658
-0.503
-0.63%
1 jan 1994 ano
80.609
+0.951
1.19%
1 jan 1995 ano
80.72
+0.11
0.14%
1 jan 1996 ano
81.796
+1.076
1.33%
1 jan 1997 ano
79.643
-2.153
-2.63%
1 jan 1998 ano
83.49
+3.848
4.83%
1 jan 1999 ano
85.38
+1.889
2.26%
1 jan 2000 ano
85.528
+0.148
0.17%
1 jan 2001 ano
87.972
+2.444
2.86%
1 jan 2002 ano
89.934
+1.962
2.23%
1 jan 2003 ano
92.37
+2.436
2.71%
1 jan 2004 ano
94.711
+2.341
2.53%
1 jan 2005 ano
96.488
+1.777
1.88%
1 jan 2006 ano
98.394
+1.906
1.98%
1 jan 2007 ano
99.5
+1.105
1.12%
1 jan 2008 ano
99.761
+0.262
0.26%
1 jan 2009 ano
100.551
+0.79
0.79%
1 jan 2010 ano
100.411
-0.14
-0.14%
1 jan 2011 ano
99.987
-0.424
-0.42%
1 jan 2012 ano
100.944
+0.957
0.96%
1 jan 2013 ano
101.469
+0.525
0.52%
1 jan 2014 ano
101.452
-0.017
-0.02%
1 jan 2015 ano
102.011
+0.559
0.55%
Classificação de países por estatísticas atuais por anos


Comentários: