29
/pt/
pt
AIzaSyAYiBZKx7MnpbEhh9jyipgxe19OcubqV5w
April 1, 2024
50443
Middle East & North Africa (IDA & IBRD countries)
TMN
false
2
1
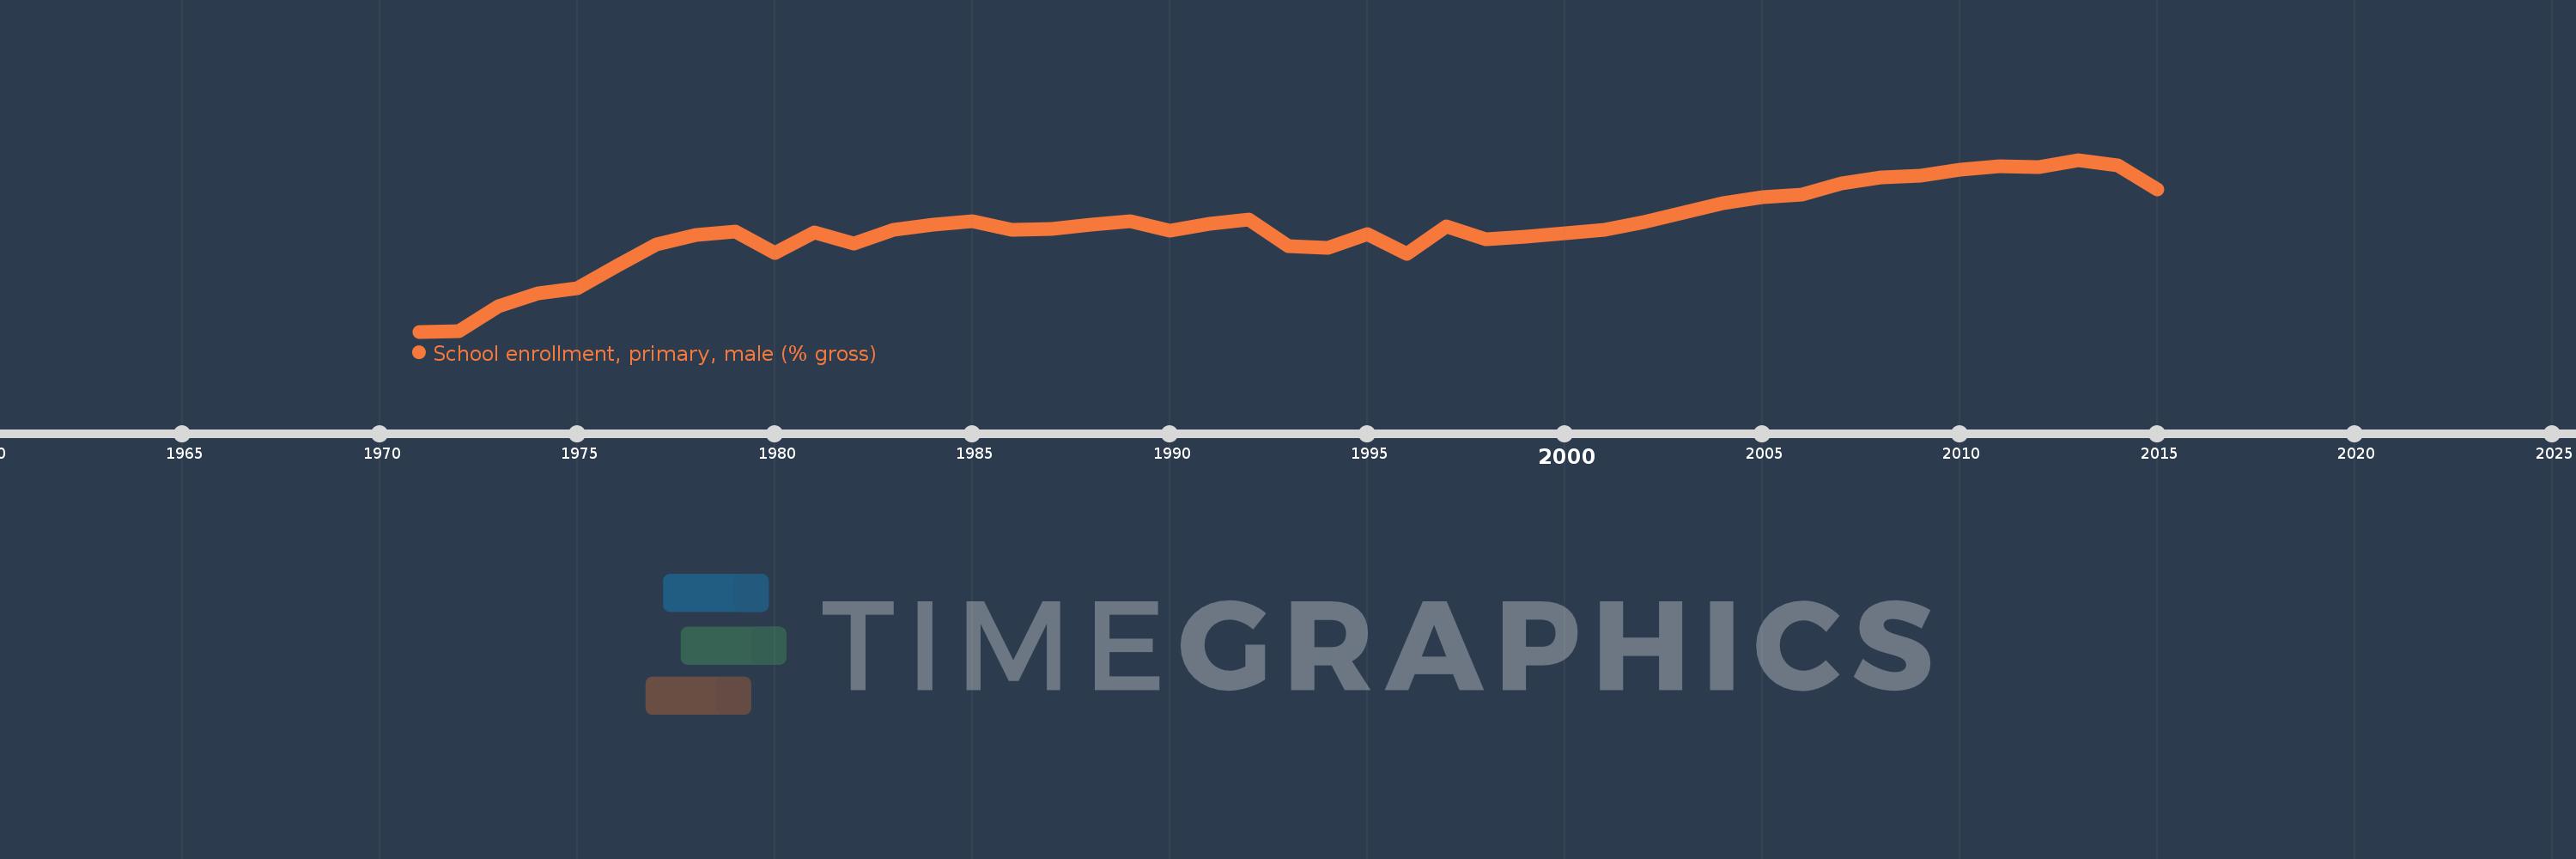
School enrollment, primary, male (% gross)
2015,2014,2013,2012,2011,2010,2009,2008,2007,2006,2005,2004,2003,2002,2001,2000,1999,1998,1997,1996,1995,1994,1993,1992,1991,1990,1989,1988,1987,1986,1985,1984,1983,1982,1981,1980,1979,1978,1977,1976,1975,1974,1973,1972,1971
Estas estatísticas em outros países:
AfghanistanAlbaniaAlgeriaAndorraAngolaAntigua and BarbudaArab WorldArgentinaArmeniaArubaAustraliaAustriaAzerbaijanBahamas, TheBahrainBangladeshBarbadosBelarusBelgiumBelizeBeninBermudaBhutanBoliviaBosnia and HerzegovinaBotswanaBrazilBrunei DarussalamBulgariaBurkina FasoBurundiCabo VerdeCambodiaCameroonCanadaCaribbean small statesCentral African RepublicCentral Europe and the BalticsChadChileChinaColombiaComorosCongo, Dem. Rep.Congo, Rep.Costa RicaCote d'IvoireCroatiaCubaCuracaoCyprusCzech RepublicDenmarkDjiboutiDominicaDominican RepublicEarly-demographic dividendEast Asia & PacificEast Asia & Pacific (excluding high income)East Asia & Pacific (IDA & IBRD countries)EcuadorEgypt, Arab Rep.El SalvadorEquatorial GuineaEritreaEstoniaEthiopiaEuro areaEurope & Central AsiaEurope & Central Asia (excluding high income)Europe & Central Asia (IDA & IBRD countries)European UnionFijiFinlandFragile and conflict affected situationsFranceGabonGambia, TheGeorgiaGermanyGhanaGreeceGrenadaGuatemalaGuineaGuinea-BissauGuyanaHaitiHeavily indebted poor countries (HIPC)High incomeHondurasHong Kong SAR, ChinaHungaryIBRD onlyIcelandIDA & IBRD totalIDA blendIDA onlyIDA totalIndiaIndonesiaIran, Islamic Rep.IraqIrelandIsraelItalyJamaicaJapanJordanKazakhstanKenyaKiribatiKorea, Dem. People’s Rep.Korea, Rep.KuwaitKyrgyz RepublicLao PDRLate-demographic dividendLatin America & Caribbean Latin America & Caribbean (excluding high income)Latin America & the Caribbean (IDA & IBRD countries)LatviaLeast developed countries: UN classificationLebanonLesothoLiberiaLibyaLiechtensteinLithuaniaLow & middle incomeLow incomeLower middle incomeLuxembourgMacao SAR, ChinaMacedonia, FYRMadagascarMalawiMaldivesMaliMaltaMarshall IslandsMauritaniaMauritiusMexicoMicronesia, Fed. Sts.Middle East & North AfricaMiddle East & North Africa (excluding high income)Middle East & North Africa (IDA & IBRD countries)Middle incomeMoldovaMongoliaMontenegroMoroccoMozambiqueMyanmarNamibiaNauruNepalNetherlandsNew ZealandNicaraguaNigerNigeriaNorth AmericaNorwayOECD membersOmanOther small statesPacific island small statesPakistanPalauPanamaPapua New GuineaParaguayPeruPhilippinesPolandPortugalPost-demographic dividendPre-demographic dividendPuerto RicoQatarRomaniaRussian FederationRwandaSamoaSan MarinoSao Tome and PrincipeSaudi ArabiaSenegalSerbiaSeychellesSierra LeoneSlovak RepublicSloveniaSmall statesSolomon IslandsSomaliaSouth AfricaSouth AsiaSouth Asia (IDA & IBRD)South SudanSpainSri LankaSt. Kitts and NevisSt. LuciaSt. Vincent and the GrenadinesSub-Saharan Africa Sub-Saharan Africa (excluding high income)Sub-Saharan Africa (IDA & IBRD countries)SudanSurinameSwazilandSwedenSwitzerlandSyrian Arab RepublicTajikistanTanzaniaThailandTimor-LesteTogoTongaTrinidad and TobagoTunisiaTurkeyTurkmenistanTuvaluUgandaUkraineUnited Arab EmiratesUnited KingdomUnited StatesUpper middle incomeUruguayUzbekistanVanuatuVenezuela, RBVietnamWest Bank and GazaWorldYemen, Rep.ZambiaZimbabwe Linha do tempo:
Nesta escala de tempo está apresentado um gráfico de 1971 ano até 2015 ano Middle East & North Africa (IDA & IBRD countries). Dados de 1970 ano ausente. O número de observações reais por data: 45.
Fonte (nome):
Indicadores de desenvolvimento mundial
Fonte (organização):
United Nations Educational, Scientific, and Cultural Organization (UNESCO) Institute for Statistics.
Categorias:
Education, Gender
Foi atualizado:
23 abr 2017 ano
Indicadores de alterações dos valores ao longo dos anos
Mínimo:
89.479
1 jan 1971 ano
Máximo:
111.328
1 jan 2013 ano
Na data de observação
Valor
Mudança absoluta
A alteração em relação ao valor anterior
1 jan 1971 ano
89.479
+89.479
0.0%
1 jan 1972 ano
89.558
+0.079
0.09%
1 jan 1973 ano
92.67
+3.112
3.47%
1 jan 1974 ano
94.358
+1.688
1.82%
1 jan 1975 ano
94.961
+0.603
0.64%
1 jan 1976 ano
97.853
+2.892
3.05%
1 jan 1977 ano
100.568
+2.715
2.77%
1 jan 1978 ano
101.762
+1.194
1.19%
1 jan 1979 ano
102.243
+0.481
0.47%
1 jan 1980 ano
99.47
-2.773
-2.71%
1 jan 1981 ano
102.131
+2.66
2.67%
1 jan 1982 ano
100.721
-1.41
-1.38%
1 jan 1983 ano
102.467
+1.746
1.73%
1 jan 1984 ano
103.053
+0.586
0.57%
1 jan 1985 ano
103.497
+0.443
0.43%
1 jan 1986 ano
102.382
-1.115
-1.08%
1 jan 1987 ano
102.515
+0.133
0.13%
1 jan 1988 ano
103.064
+0.549
0.54%
1 jan 1989 ano
103.571
+0.508
0.49%
1 jan 1990 ano
102.358
-1.213
-1.17%
1 jan 1991 ano
103.16
+0.802
0.78%
1 jan 1992 ano
103.768
+0.608
0.59%
1 jan 1993 ano
100.367
-3.401
-3.28%
1 jan 1994 ano
100.112
-0.255
-0.25%
1 jan 1995 ano
101.878
+1.766
1.76%
1 jan 1996 ano
99.41
-2.468
-2.42%
1 jan 1997 ano
102.846
+3.435
3.46%
1 jan 1998 ano
101.205
-1.641
-1.6%
1 jan 1999 ano
101.601
+0.396
0.39%
1 jan 2000 ano
102.008
+0.407
0.4%
1 jan 2001 ano
102.477
+0.469
0.46%
1 jan 2002 ano
103.445
+0.968
0.94%
1 jan 2003 ano
104.655
+1.211
1.17%
1 jan 2004 ano
105.852
+1.197
1.14%
1 jan 2005 ano
106.545
+0.692
0.65%
1 jan 2006 ano
106.9
+0.356
0.33%
1 jan 2007 ano
108.307
+1.407
1.32%
1 jan 2008 ano
109.067
+0.76
0.7%
1 jan 2009 ano
109.36
+0.293
0.27%
1 jan 2010 ano
110.082
+0.722
0.66%
1 jan 2011 ano
110.54
+0.458
0.42%
1 jan 2012 ano
110.447
-0.093
-0.08%
1 jan 2013 ano
111.328
+0.881
0.8%
1 jan 2014 ano
110.625
-0.704
-0.63%
1 jan 2015 ano
107.561
-3.064
-2.77%
Classificação de países por estatísticas atuais por anos


Comentários: