29
/pt/
pt
AIzaSyAYiBZKx7MnpbEhh9jyipgxe19OcubqV5w
April 1, 2024
214771
Norway
NOR
true
2
1
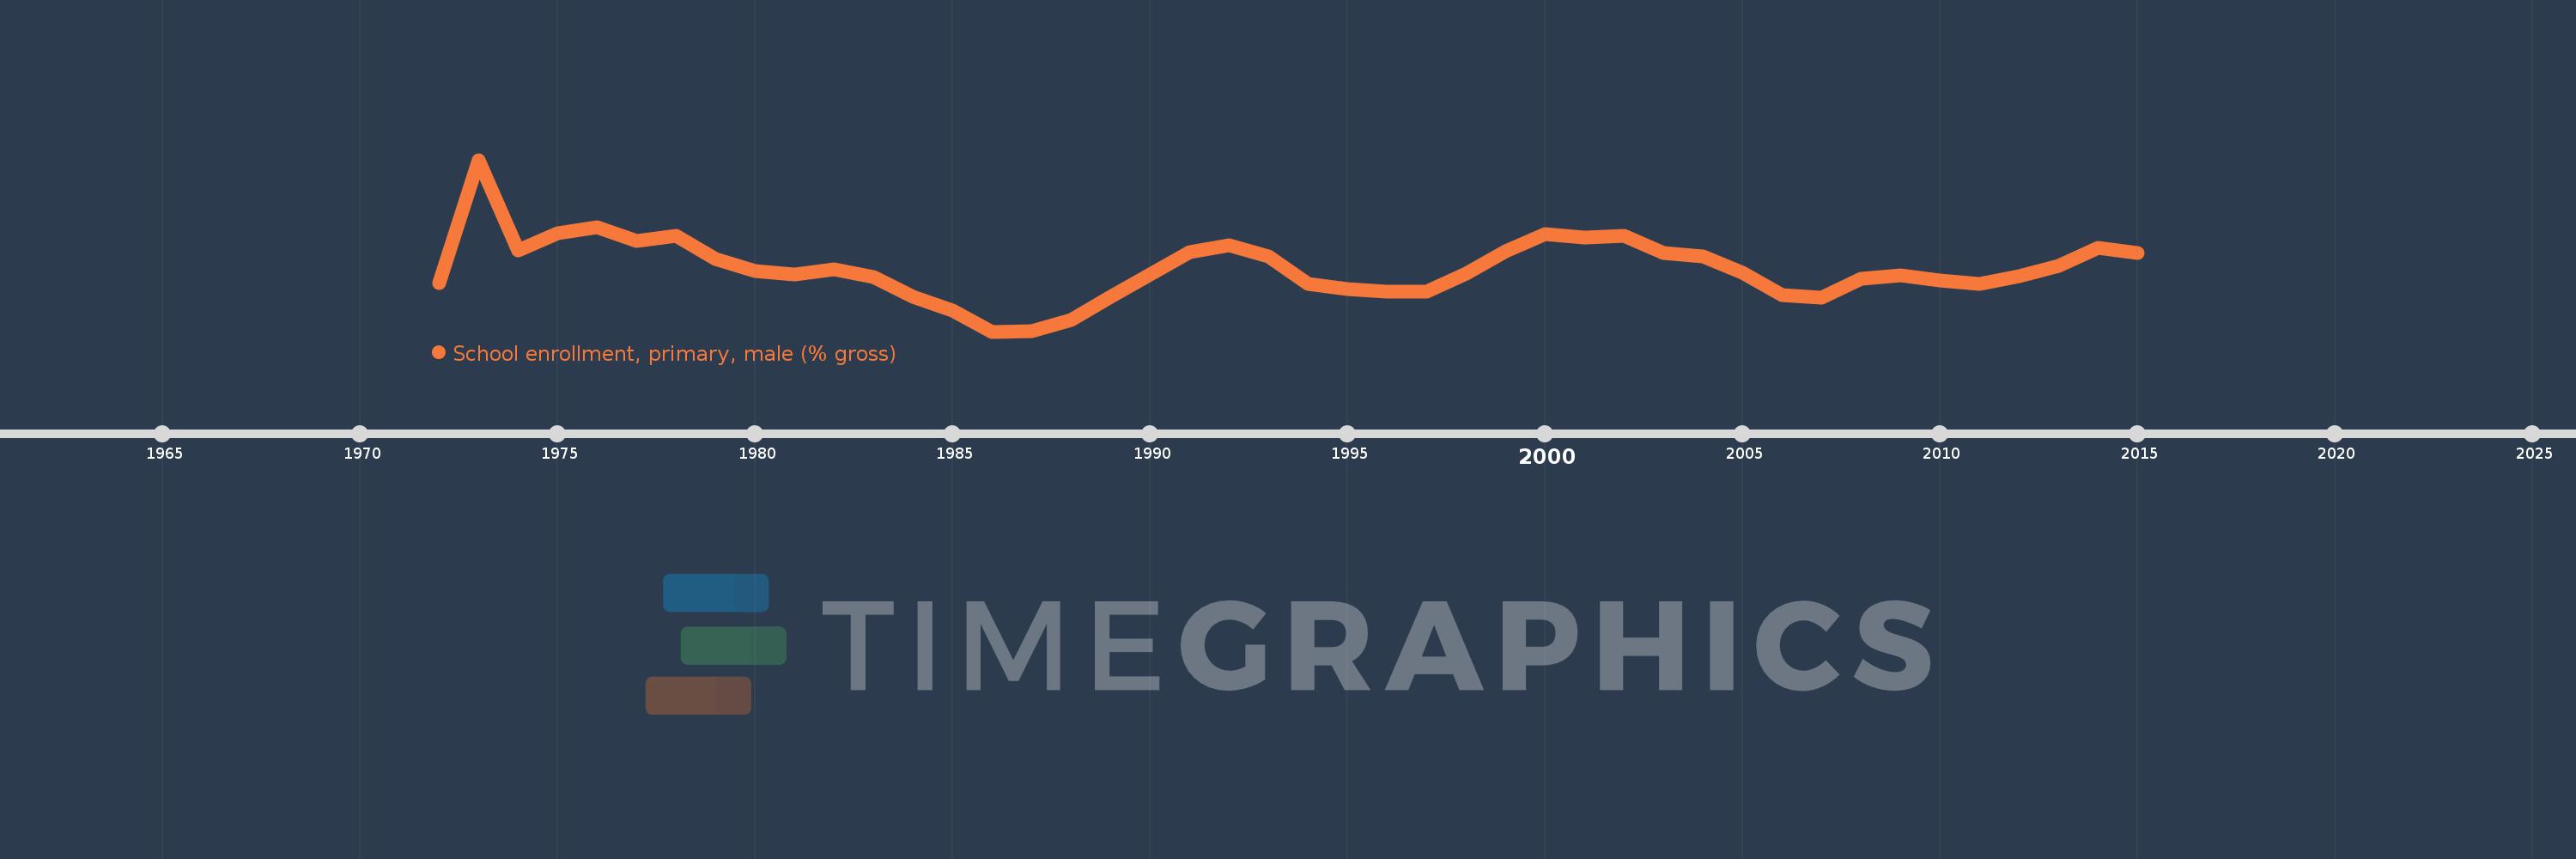
School enrollment, primary, male (% gross)
2015,2014,2013,2012,2011,2010,2009,2008,2007,2006,2005,2004,2003,2002,2001,2000,1999,1998,1997,1996,1995,1994,1993,1992,1991,1990,1989,1988,1987,1986,1985,1984,1983,1982,1981,1980,1979,1978,1977,1976,1975,1974,1973,1972
Estas estatísticas em outros países:
AfghanistanAlbaniaAlgeriaAndorraAngolaAntigua and BarbudaArab WorldArgentinaArmeniaArubaAustraliaAustriaAzerbaijanBahamas, TheBahrainBangladeshBarbadosBelarusBelgiumBelizeBeninBermudaBhutanBoliviaBosnia and HerzegovinaBotswanaBrazilBrunei DarussalamBulgariaBurkina FasoBurundiCabo VerdeCambodiaCameroonCanadaCaribbean small statesCentral African RepublicCentral Europe and the BalticsChadChileChinaColombiaComorosCongo, Dem. Rep.Congo, Rep.Costa RicaCote d'IvoireCroatiaCubaCuracaoCyprusCzech RepublicDenmarkDjiboutiDominicaDominican RepublicEarly-demographic dividendEast Asia & PacificEast Asia & Pacific (excluding high income)East Asia & Pacific (IDA & IBRD countries)EcuadorEgypt, Arab Rep.El SalvadorEquatorial GuineaEritreaEstoniaEthiopiaEuro areaEurope & Central AsiaEurope & Central Asia (excluding high income)Europe & Central Asia (IDA & IBRD countries)European UnionFijiFinlandFragile and conflict affected situationsFranceGabonGambia, TheGeorgiaGermanyGhanaGreeceGrenadaGuatemalaGuineaGuinea-BissauGuyanaHaitiHeavily indebted poor countries (HIPC)High incomeHondurasHong Kong SAR, ChinaHungaryIBRD onlyIcelandIDA & IBRD totalIDA blendIDA onlyIDA totalIndiaIndonesiaIran, Islamic Rep.IraqIrelandIsraelItalyJamaicaJapanJordanKazakhstanKenyaKiribatiKorea, Dem. People’s Rep.Korea, Rep.KuwaitKyrgyz RepublicLao PDRLate-demographic dividendLatin America & Caribbean Latin America & Caribbean (excluding high income)Latin America & the Caribbean (IDA & IBRD countries)LatviaLeast developed countries: UN classificationLebanonLesothoLiberiaLibyaLiechtensteinLithuaniaLow & middle incomeLow incomeLower middle incomeLuxembourgMacao SAR, ChinaMacedonia, FYRMadagascarMalawiMaldivesMaliMaltaMarshall IslandsMauritaniaMauritiusMexicoMicronesia, Fed. Sts.Middle East & North AfricaMiddle East & North Africa (excluding high income)Middle East & North Africa (IDA & IBRD countries)Middle incomeMoldovaMongoliaMontenegroMoroccoMozambiqueMyanmarNamibiaNauruNepalNetherlandsNew ZealandNicaraguaNigerNigeriaNorth AmericaNorwayOECD membersOmanOther small statesPacific island small statesPakistanPalauPanamaPapua New GuineaParaguayPeruPhilippinesPolandPortugalPost-demographic dividendPre-demographic dividendPuerto RicoQatarRomaniaRussian FederationRwandaSamoaSan MarinoSao Tome and PrincipeSaudi ArabiaSenegalSerbiaSeychellesSierra LeoneSlovak RepublicSloveniaSmall statesSolomon IslandsSomaliaSouth AfricaSouth AsiaSouth Asia (IDA & IBRD)South SudanSpainSri LankaSt. Kitts and NevisSt. LuciaSt. Vincent and the GrenadinesSub-Saharan Africa Sub-Saharan Africa (excluding high income)Sub-Saharan Africa (IDA & IBRD countries)SudanSurinameSwazilandSwedenSwitzerlandSyrian Arab RepublicTajikistanTanzaniaThailandTimor-LesteTogoTongaTrinidad and TobagoTunisiaTurkeyTurkmenistanTuvaluUgandaUkraineUnited Arab EmiratesUnited KingdomUnited StatesUpper middle incomeUruguayUzbekistanVanuatuVenezuela, RBVietnamWest Bank and GazaWorldYemen, Rep.ZambiaZimbabwe Linha do tempo:
Nesta escala de tempo está apresentado um gráfico de 1972 ano até 2015 ano Norway. Dados de 1971 ano ausente. O número de observações reais por data: 44.
Fonte (nome):
Indicadores de desenvolvimento mundial
Fonte (organização):
United Nations Educational, Scientific, and Cultural Organization (UNESCO) Institute for Statistics.
Categorias:
Education, Gender
Foi atualizado:
23 abr 2017 ano
Indicadores de alterações dos valores ao longo dos anos
Mínimo:
96.935
1 jan 1986 ano
Máximo:
103.984
1 jan 1973 ano
Na data de observação
Valor
Mudança absoluta
A alteração em relação ao valor anterior
1 jan 1972 ano
98.922
+98.922
0.0%
1 jan 1973 ano
103.984
+5.062
5.12%
1 jan 1974 ano
100.262
-3.721
-3.58%
1 jan 1975 ano
100.977
+0.715
0.71%
1 jan 1976 ano
101.21
+0.233
0.23%
1 jan 1977 ano
100.658
-0.552
-0.55%
1 jan 1978 ano
100.882
+0.224
0.22%
1 jan 1979 ano
99.926
-0.956
-0.95%
1 jan 1980 ano
99.423
-0.503
-0.5%
1 jan 1981 ano
99.295
-0.128
-0.13%
1 jan 1982 ano
99.48
+0.184
0.19%
1 jan 1983 ano
99.169
-0.31
-0.31%
1 jan 1984 ano
98.346
-0.823
-0.83%
1 jan 1985 ano
97.804
-0.542
-0.55%
1 jan 1986 ano
96.935
-0.869
-0.89%
1 jan 1987 ano
96.953
+0.018
0.02%
1 jan 1988 ano
97.411
+0.458
0.47%
1 jan 1989 ano
98.347
+0.936
0.96%
1 jan 1990 ano
99.265
+0.918
0.93%
1 jan 1991 ano
100.192
+0.927
0.93%
1 jan 1992 ano
100.462
+0.27
0.27%
1 jan 1993 ano
100.016
-0.446
-0.44%
1 jan 1994 ano
98.876
-1.14
-1.14%
1 jan 1995 ano
98.665
-0.212
-0.21%
1 jan 1996 ano
98.566
-0.098
-0.1%
1 jan 1997 ano
98.573
+0.007
0.01%
1 jan 1998 ano
99.31
+0.737
0.75%
1 jan 1999 ano
100.226
+0.916
0.92%
1 jan 2000 ano
100.926
+0.7
0.7%
1 jan 2001 ano
100.81
-0.117
-0.12%
1 jan 2002 ano
100.862
+0.052
0.05%
1 jan 2003 ano
100.157
-0.705
-0.7%
1 jan 2004 ano
100.036
-0.121
-0.12%
1 jan 2005 ano
99.356
-0.679
-0.68%
1 jan 2006 ano
98.443
-0.913
-0.92%
1 jan 2007 ano
98.323
-0.12
-0.12%
1 jan 2008 ano
99.113
+0.789
0.8%
1 jan 2009 ano
99.235
+0.123
0.12%
1 jan 2010 ano
99.042
-0.193
-0.19%
1 jan 2011 ano
98.899
-0.143
-0.14%
1 jan 2012 ano
99.199
+0.3
0.3%
1 jan 2013 ano
99.64
+0.44
0.44%
1 jan 2014 ano
100.377
+0.737
0.74%
1 jan 2015 ano
100.164
-0.213
-0.21%
Classificação de países por estatísticas atuais por anos


Comentários: