29
/pt/
pt
AIzaSyAYiBZKx7MnpbEhh9jyipgxe19OcubqV5w
April 1, 2024
119367
Denmark
DNK
true
2
1
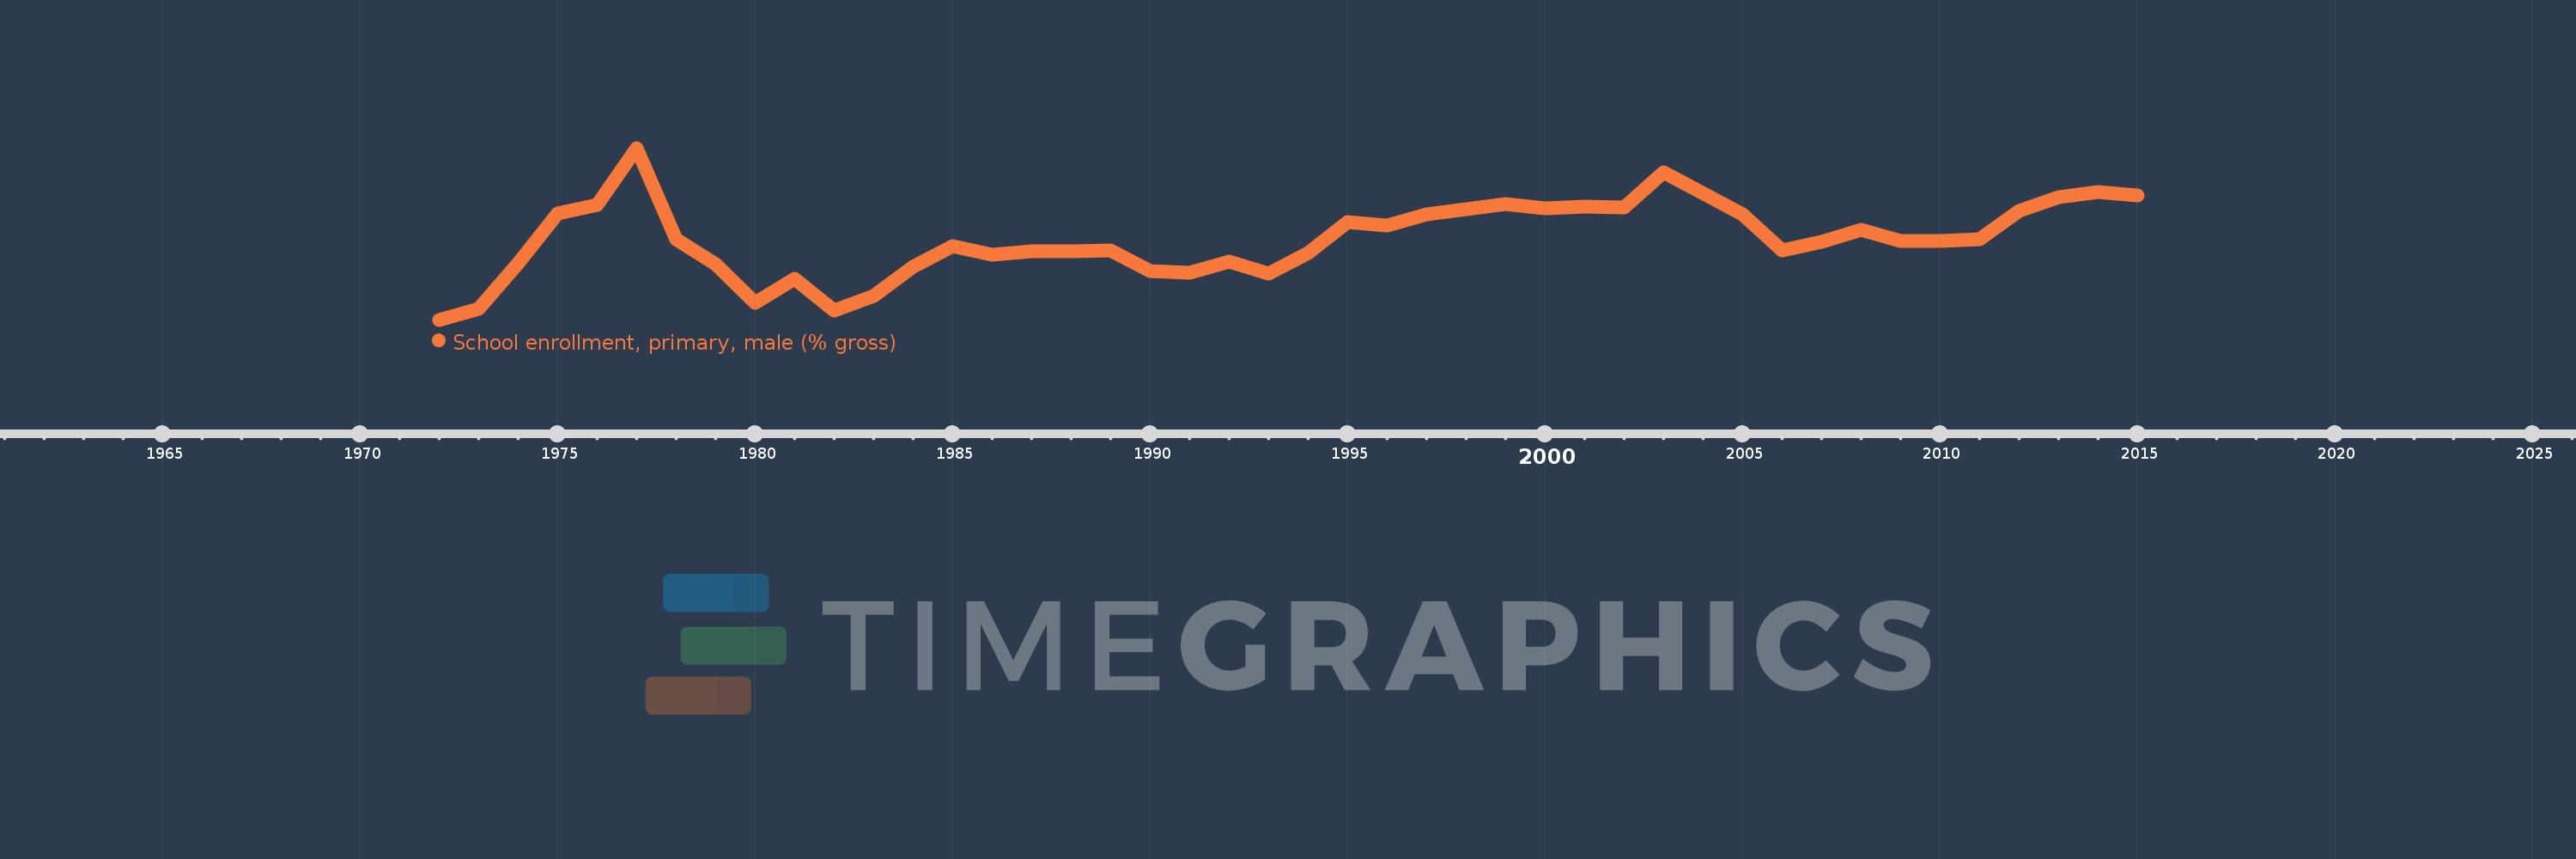
School enrollment, primary, male (% gross)
2015,2014,2013,2012,2011,2010,2009,2008,2007,2006,2005,2003,2002,2001,2000,1999,1997,1996,1995,1994,1993,1992,1991,1990,1989,1988,1987,1986,1985,1984,1983,1982,1981,1980,1979,1978,1977,1976,1975,1974,1973,1972
Estas estatísticas em outros países:
AfghanistanAlbaniaAlgeriaAndorraAngolaAntigua and BarbudaArab WorldArgentinaArmeniaArubaAustraliaAustriaAzerbaijanBahamas, TheBahrainBangladeshBarbadosBelarusBelgiumBelizeBeninBermudaBhutanBoliviaBosnia and HerzegovinaBotswanaBrazilBrunei DarussalamBulgariaBurkina FasoBurundiCabo VerdeCambodiaCameroonCanadaCaribbean small statesCentral African RepublicCentral Europe and the BalticsChadChileChinaColombiaComorosCongo, Dem. Rep.Congo, Rep.Costa RicaCote d'IvoireCroatiaCubaCuracaoCyprusCzech RepublicDenmarkDjiboutiDominicaDominican RepublicEarly-demographic dividendEast Asia & PacificEast Asia & Pacific (excluding high income)East Asia & Pacific (IDA & IBRD countries)EcuadorEgypt, Arab Rep.El SalvadorEquatorial GuineaEritreaEstoniaEthiopiaEuro areaEurope & Central AsiaEurope & Central Asia (excluding high income)Europe & Central Asia (IDA & IBRD countries)European UnionFijiFinlandFragile and conflict affected situationsFranceGabonGambia, TheGeorgiaGermanyGhanaGreeceGrenadaGuatemalaGuineaGuinea-BissauGuyanaHaitiHeavily indebted poor countries (HIPC)High incomeHondurasHong Kong SAR, ChinaHungaryIBRD onlyIcelandIDA & IBRD totalIDA blendIDA onlyIDA totalIndiaIndonesiaIran, Islamic Rep.IraqIrelandIsraelItalyJamaicaJapanJordanKazakhstanKenyaKiribatiKorea, Dem. People’s Rep.Korea, Rep.KuwaitKyrgyz RepublicLao PDRLate-demographic dividendLatin America & Caribbean Latin America & Caribbean (excluding high income)Latin America & the Caribbean (IDA & IBRD countries)LatviaLeast developed countries: UN classificationLebanonLesothoLiberiaLibyaLiechtensteinLithuaniaLow & middle incomeLow incomeLower middle incomeLuxembourgMacao SAR, ChinaMacedonia, FYRMadagascarMalawiMaldivesMaliMaltaMarshall IslandsMauritaniaMauritiusMexicoMicronesia, Fed. Sts.Middle East & North AfricaMiddle East & North Africa (excluding high income)Middle East & North Africa (IDA & IBRD countries)Middle incomeMoldovaMongoliaMontenegroMoroccoMozambiqueMyanmarNamibiaNauruNepalNetherlandsNew ZealandNicaraguaNigerNigeriaNorth AmericaNorwayOECD membersOmanOther small statesPacific island small statesPakistanPalauPanamaPapua New GuineaParaguayPeruPhilippinesPolandPortugalPost-demographic dividendPre-demographic dividendPuerto RicoQatarRomaniaRussian FederationRwandaSamoaSan MarinoSao Tome and PrincipeSaudi ArabiaSenegalSerbiaSeychellesSierra LeoneSlovak RepublicSloveniaSmall statesSolomon IslandsSomaliaSouth AfricaSouth AsiaSouth Asia (IDA & IBRD)South SudanSpainSri LankaSt. Kitts and NevisSt. LuciaSt. Vincent and the GrenadinesSub-Saharan Africa Sub-Saharan Africa (excluding high income)Sub-Saharan Africa (IDA & IBRD countries)SudanSurinameSwazilandSwedenSwitzerlandSyrian Arab RepublicTajikistanTanzaniaThailandTimor-LesteTogoTongaTrinidad and TobagoTunisiaTurkeyTurkmenistanTuvaluUgandaUkraineUnited Arab EmiratesUnited KingdomUnited StatesUpper middle incomeUruguayUzbekistanVanuatuVenezuela, RBVietnamWest Bank and GazaWorldYemen, Rep.ZambiaZimbabwe Linha do tempo:
Nesta escala de tempo está apresentado um gráfico de 1972 ano até 2015 ano Denmark. Dados de 1971 ano ausente. O número de observações reais por data: 42.
Fonte (nome):
Indicadores de desenvolvimento mundial
Fonte (organização):
United Nations Educational, Scientific, and Cultural Organization (UNESCO) Institute for Statistics.
Categorias:
Education, Gender
Foi atualizado:
23 abr 2017 ano
Indicadores de alterações dos valores ao longo dos anos
Mínimo:
94.955
1 jan 1972 ano
Máximo:
104.644
1 jan 1977 ano
Na data de observação
Valor
Mudança absoluta
A alteração em relação ao valor anterior
1 jan 1972 ano
94.955
+94.955
0.0%
1 jan 1973 ano
95.573
+0.618
0.65%
1 jan 1974 ano
98.138
+2.566
2.68%
1 jan 1975 ano
100.951
+2.812
2.87%
1 jan 1976 ano
101.449
+0.499
0.49%
1 jan 1977 ano
104.644
+3.195
3.15%
1 jan 1978 ano
99.475
-5.169
-4.94%
1 jan 1979 ano
98.102
-1.374
-1.38%
1 jan 1980 ano
95.909
-2.192
-2.23%
1 jan 1981 ano
97.285
+1.376
1.43%
1 jan 1982 ano
95.453
-1.833
-1.88%
1 jan 1983 ano
96.282
+0.83
0.87%
1 jan 1984 ano
97.936
+1.654
1.72%
1 jan 1985 ano
99.087
+1.15
1.17%
1 jan 1986 ano
98.624
-0.463
-0.47%
1 jan 1987 ano
98.816
+0.193
0.2%
1 jan 1988 ano
98.816
-0.001
0.0%
1 jan 1989 ano
98.882
+0.066
0.07%
1 jan 1990 ano
97.723
-1.159
-1.17%
1 jan 1991 ano
97.597
-0.126
-0.13%
1 jan 1992 ano
98.251
+0.654
0.67%
1 jan 1993 ano
97.573
-0.679
-0.69%
1 jan 1994 ano
98.739
+1.166
1.2%
1 jan 1995 ano
100.479
+1.74
1.76%
1 jan 1996 ano
100.284
-0.195
-0.19%
1 jan 1997 ano
100.882
+0.598
0.6%
1 jan 1999 ano
101.478
+0.596
0.59%
1 jan 2000 ano
101.217
-0.261
-0.26%
1 jan 2001 ano
101.35
+0.133
0.13%
1 jan 2002 ano
101.281
-0.069
-0.07%
1 jan 2003 ano
103.268
+1.986
1.96%
1 jan 2005 ano
100.888
-2.379
-2.3%
1 jan 2006 ano
98.872
-2.016
-2.0%
1 jan 2007 ano
99.355
+0.483
0.49%
1 jan 2008 ano
100.038
+0.683
0.69%
1 jan 2009 ano
99.375
-0.663
-0.66%
1 jan 2010 ano
99.4
+0.025
0.03%
1 jan 2011 ano
99.493
+0.093
0.09%
1 jan 2012 ano
101.094
+1.601
1.61%
1 jan 2013 ano
101.848
+0.754
0.75%
1 jan 2014 ano
102.14
+0.291
0.29%
1 jan 2015 ano
101.976
-0.164
-0.16%
Classificação de países por estatísticas atuais por anos


Comentários: