29
/pt/
pt
AIzaSyAYiBZKx7MnpbEhh9jyipgxe19OcubqV5w
April 1, 2024
61922
Upper middle income
UMC
false
2
1
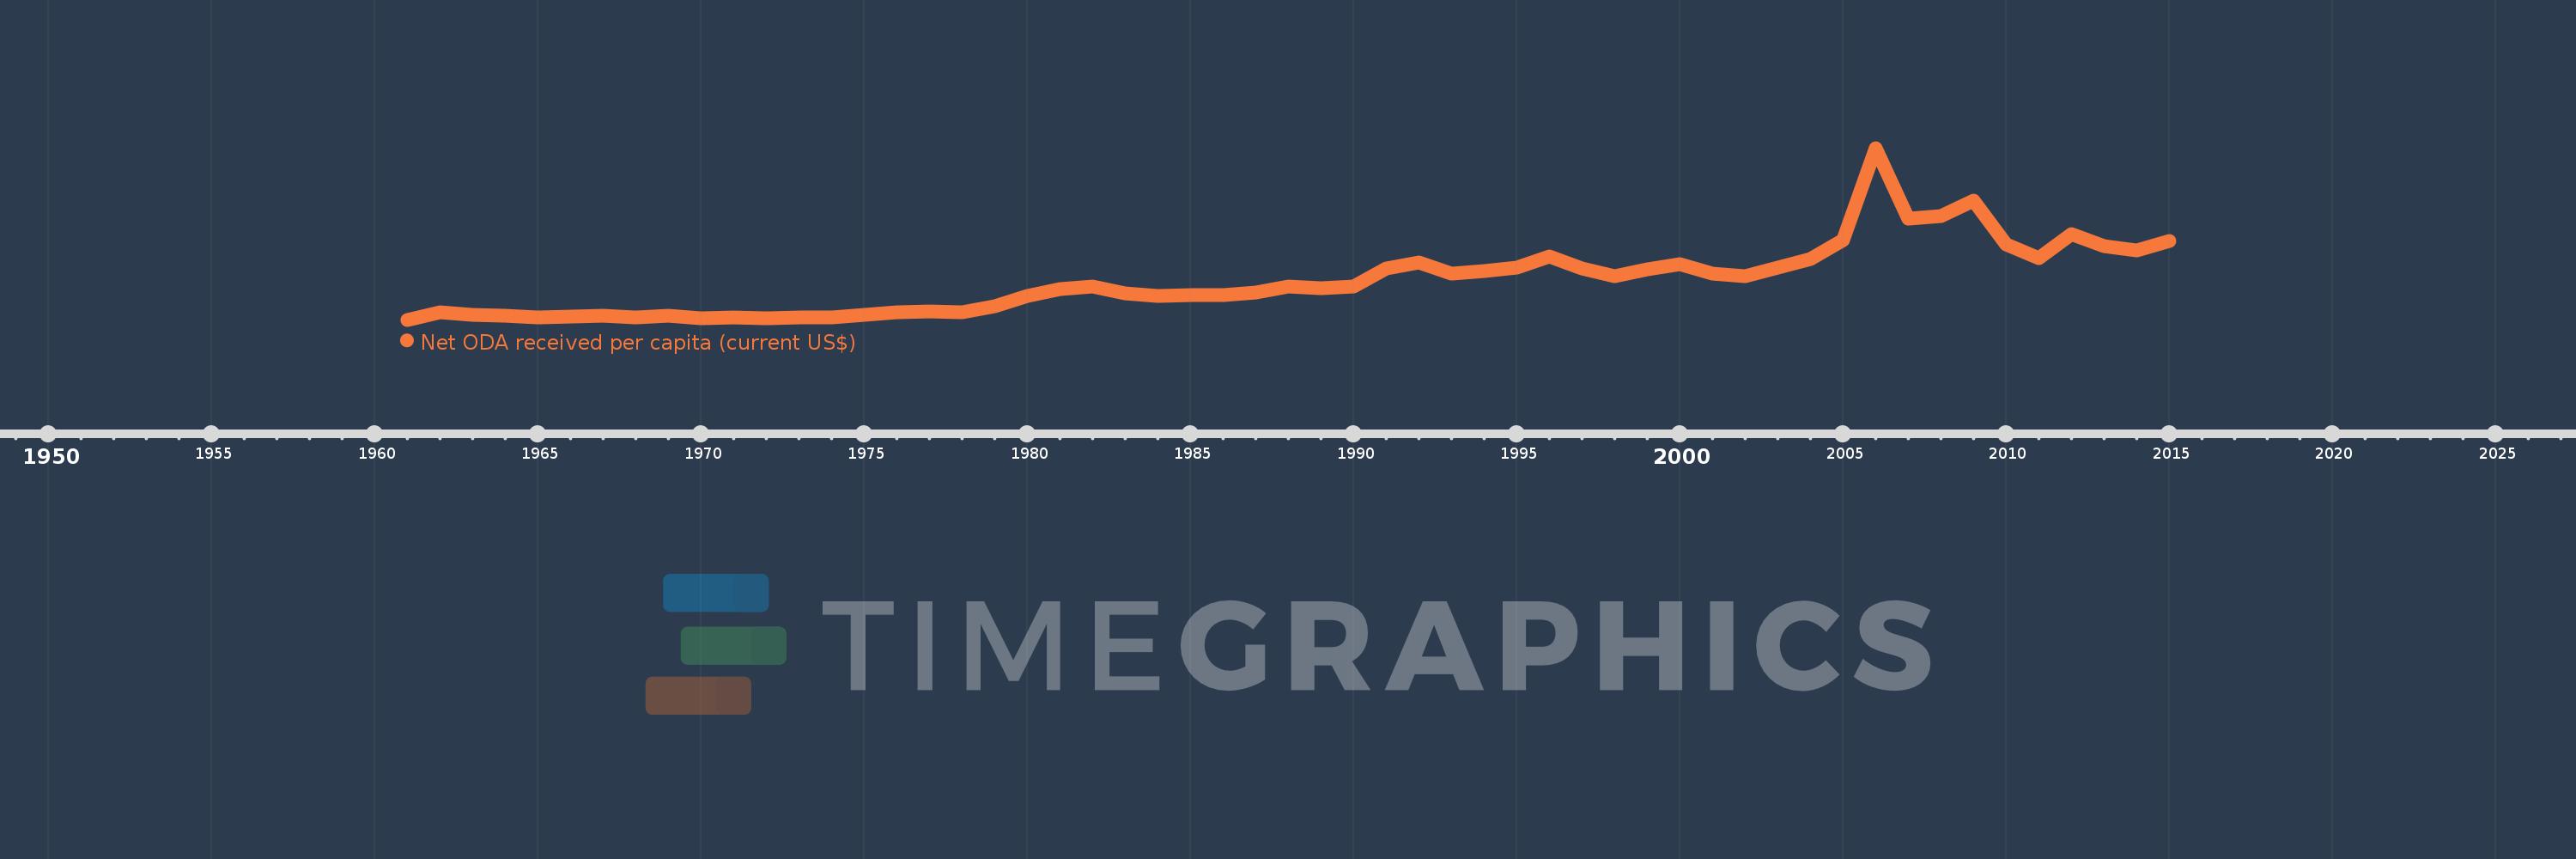
Net ODA received per capita (current US$)
2015,2014,2013,2012,2011,2010,2009,2008,2007,2006,2005,2004,2003,2002,2001,2000,1999,1998,1997,1996,1995,1994,1993,1992,1991,1990,1989,1988,1987,1986,1985,1984,1983,1982,1981,1980,1979,1978,1977,1976,1975,1974,1973,1972,1971,1970,1969,1968,1967,1966,1965,1964,1963,1962,1961
Estas estatísticas em outros países:
AfghanistanAlbaniaAlgeriaAngolaAntigua and BarbudaArab WorldArgentinaArmeniaArubaAzerbaijanBahamas, TheBahrainBangladeshBarbadosBelarusBelizeBeninBermudaBhutanBoliviaBosnia and HerzegovinaBotswanaBrazilBritish Virgin IslandsBrunei DarussalamBurkina FasoBurundiCabo VerdeCambodiaCameroonCaribbean small statesCayman IslandsCentral African RepublicCentral Europe and the BalticsChadChileChinaColombiaComorosCongo, Dem. Rep.Congo, Rep.Costa RicaCote d'IvoireCroatiaCubaCyprusDjiboutiDominicaDominican RepublicEast Asia & PacificEast Asia & Pacific (excluding high income)East Asia & Pacific (IDA & IBRD countries)EcuadorEgypt, Arab Rep.El SalvadorEquatorial GuineaEritreaEthiopiaEuro areaEurope & Central AsiaEurope & Central Asia (excluding high income)Europe & Central Asia (IDA & IBRD countries)European UnionFijiFragile and conflict affected situationsFrench PolynesiaGabonGambia, TheGeorgiaGhanaGibraltarGrenadaGuatemalaGuineaGuinea-BissauGuyanaHaitiHeavily indebted poor countries (HIPC)High incomeHondurasHong Kong SAR, ChinaIBRD onlyIDA & IBRD totalIDA blendIDA onlyIDA totalIndiaIndonesiaIran, Islamic Rep.IraqIsraelJamaicaJordanKazakhstanKenyaKiribatiKorea, Dem. People’s Rep.Korea, Rep.KosovoKuwaitKyrgyz RepublicLao PDRLatin America & Caribbean Latin America & Caribbean (excluding high income)Latin America & the Caribbean (IDA & IBRD countries)Least developed countries: UN classificationLebanonLesothoLiberiaLibyaLow & middle incomeLow incomeLower middle incomeMacao SAR, ChinaMacedonia, FYRMadagascarMalawiMalaysiaMaldivesMaliMaltaMarshall IslandsMauritaniaMauritiusMexicoMicronesia, Fed. Sts.Middle East & North AfricaMiddle East & North Africa (excluding high income)Middle East & North Africa (IDA & IBRD countries)Middle incomeMoldovaMongoliaMontenegroMoroccoMozambiqueMyanmarNamibiaNauruNepalNew CaledoniaNicaraguaNigerNigeriaNorth AmericaNorthern Mariana IslandsOECD membersOmanOther small statesPacific island small statesPakistanPalauPanamaPapua New GuineaParaguayPeruPhilippinesQatarRwandaSamoaSao Tome and PrincipeSaudi ArabiaSenegalSerbiaSeychellesSierra LeoneSingaporeSloveniaSmall statesSolomon IslandsSomaliaSouth AfricaSouth AsiaSouth Asia (IDA & IBRD)South SudanSri LankaSt. Kitts and NevisSt. LuciaSt. Vincent and the GrenadinesSub-Saharan Africa Sub-Saharan Africa (excluding high income)Sub-Saharan Africa (IDA & IBRD countries)SudanSurinameSwazilandSyrian Arab RepublicTajikistanTanzaniaThailandTimor-LesteTogoTongaTrinidad and TobagoTunisiaTurkeyTurkmenistanTurks and Caicos IslandsTuvaluUgandaUkraineUnited Arab EmiratesUpper middle incomeUruguayUzbekistanVanuatuVenezuela, RBVietnamWest Bank and GazaWorldYemen, Rep.ZambiaZimbabwe Linha do tempo:
Nesta escala de tempo está apresentado um gráfico de 1961 ano até 2015 ano Upper middle income. Dados de 1960 ano ausente. O número de observações reais por data: 55.
Fonte (nome):
Indicadores de desenvolvimento mundial
Fonte (organização):
Development Assistance Committee of the Organisation for Economic Co-operation and Development, Geographical Distribution of Financial Flows to Developing Countries, Development Co-operation Report, and International Development Statistics database. Data are available online at: www.oecd.org/dac/stats/idsonline. World Bank population estimates are used for the denominator.
Categorias:
Aid Effectiveness, Economy & Growth, External Debt
Foi atualizado:
23 abr 2017 ano
Indicadores de alterações dos valores ao longo dos anos
Mínimo:
0.654
1 jan 1961 ano
Máximo:
13.466
1 jan 2006 ano
Na data de observação
Valor
Mudança absoluta
A alteração em relação ao valor anterior
1 jan 1961 ano
0.654
+0.654
0.0%
1 jan 1962 ano
1.187
+0.533
81.42%
1 jan 1963 ano
1.023
-0.164
-13.8%
1 jan 1964 ano
0.937
-0.086
-8.42%
1 jan 1965 ano
0.795
-0.142
-15.18%
1 jan 1966 ano
0.867
+0.072
9.06%
1 jan 1967 ano
0.925
+0.059
6.75%
1 jan 1968 ano
0.849
-0.076
-8.23%
1 jan 1969 ano
0.929
+0.08
9.4%
1 jan 1970 ano
0.779
-0.15
-16.1%
1 jan 1971 ano
0.853
+0.073
9.39%
1 jan 1972 ano
0.782
-0.071
-8.3%
1 jan 1973 ano
0.833
+0.051
6.51%
1 jan 1974 ano
0.823
-0.01
-1.17%
1 jan 1975 ano
0.998
+0.175
21.26%
1 jan 1976 ano
1.235
+0.238
23.8%
1 jan 1977 ano
1.253
+0.018
1.43%
1 jan 1978 ano
1.196
-0.057
-4.53%
1 jan 1979 ano
1.671
+0.474
39.64%
1 jan 1980 ano
2.415
+0.744
44.56%
1 jan 1981 ano
2.918
+0.503
20.84%
1 jan 1982 ano
3.131
+0.213
7.3%
1 jan 1983 ano
2.645
-0.487
-15.55%
1 jan 1984 ano
2.456
-0.189
-7.15%
1 jan 1985 ano
2.517
+0.061
2.49%
1 jan 1986 ano
2.507
-0.01
-0.39%
1 jan 1987 ano
2.672
+0.165
6.57%
1 jan 1988 ano
3.13
+0.458
17.13%
1 jan 1989 ano
3.026
-0.104
-3.32%
1 jan 1990 ano
3.102
+0.077
2.53%
1 jan 1991 ano
4.464
+1.362
43.9%
1 jan 1992 ano
4.919
+0.456
10.21%
1 jan 1993 ano
4.083
-0.836
-17.0%
1 jan 1994 ano
4.316
+0.233
5.71%
1 jan 1995 ano
4.56
+0.244
5.65%
1 jan 1996 ano
5.39
+0.83
18.2%
1 jan 1997 ano
4.5
-0.89
-16.51%
1 jan 1998 ano
3.915
-0.585
-13.0%
1 jan 1999 ano
4.395
+0.48
12.26%
1 jan 2000 ano
4.777
+0.383
8.71%
1 jan 2001 ano
4.084
-0.694
-14.52%
1 jan 2002 ano
3.905
-0.178
-4.37%
1 jan 2003 ano
4.561
+0.656
16.79%
1 jan 2004 ano
5.182
+0.621
13.62%
1 jan 2005 ano
6.582
+1.4
27.02%
1 jan 2006 ano
13.466
+6.884
104.59%
1 jan 2007 ano
8.214
-5.252
-39.0%
1 jan 2008 ano
8.358
+0.143
1.74%
1 jan 2009 ano
9.517
+1.16
13.88%
1 jan 2010 ano
6.288
-3.229
-33.93%
1 jan 2011 ano
5.228
-1.06
-16.86%
1 jan 2012 ano
7.026
+1.799
34.41%
1 jan 2013 ano
6.171
-0.856
-12.18%
1 jan 2014 ano
5.833
-0.337
-5.47%
1 jan 2015 ano
6.498
+0.664
11.39%
Classificação de países por estatísticas atuais por anos


Comentários: