29
/pt/
pt
AIzaSyAYiBZKx7MnpbEhh9jyipgxe19OcubqV5w
April 1, 2024
146039
Guinea
GIN
true
2
1
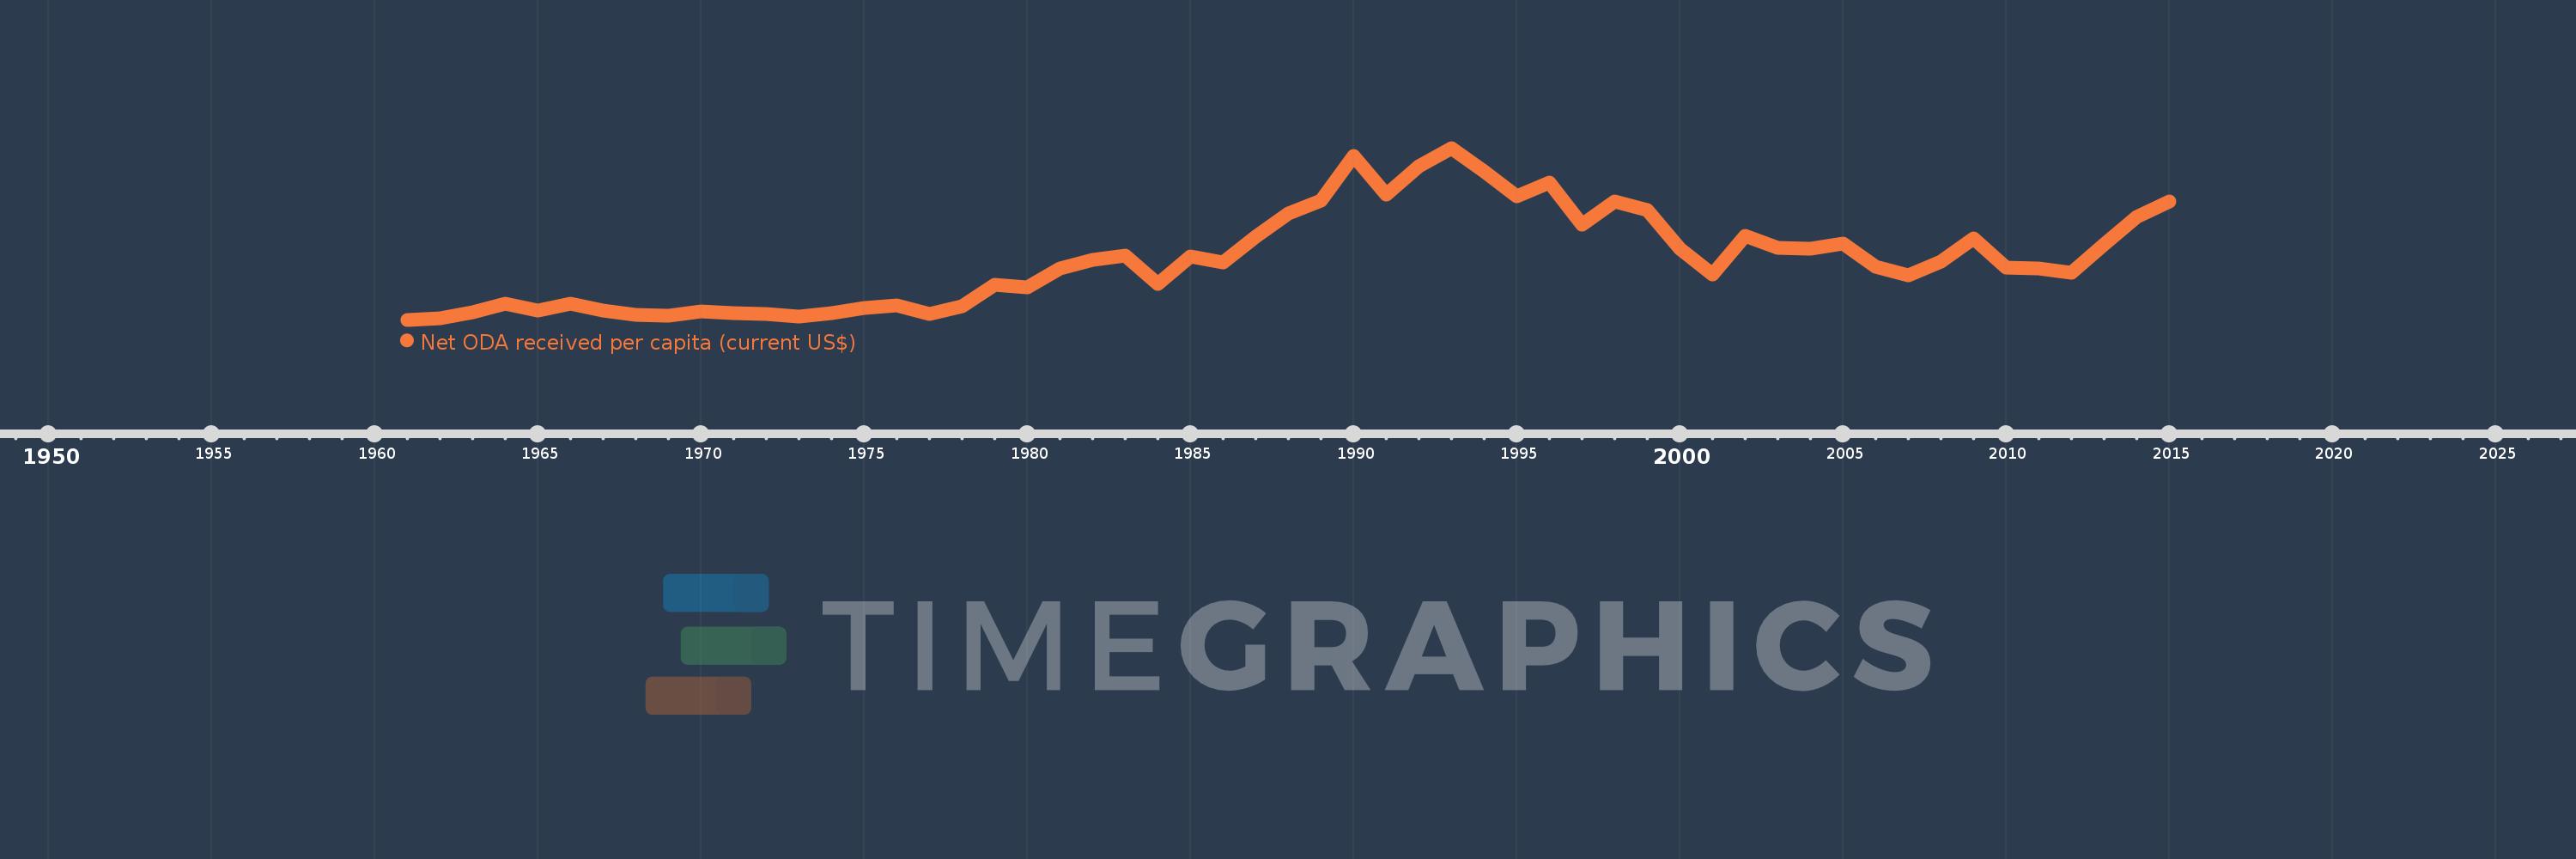
Net ODA received per capita (current US$)
2015,2014,2013,2012,2011,2010,2009,2008,2007,2006,2005,2004,2003,2002,2001,2000,1999,1998,1997,1996,1995,1994,1993,1992,1991,1990,1989,1988,1987,1986,1985,1984,1983,1982,1981,1980,1979,1978,1977,1976,1975,1974,1973,1972,1971,1970,1969,1968,1967,1966,1965,1964,1963,1962,1961
Estas estatísticas em outros países:
AfghanistanAlbaniaAlgeriaAngolaAntigua and BarbudaArab WorldArgentinaArmeniaArubaAzerbaijanBahamas, TheBahrainBangladeshBarbadosBelarusBelizeBeninBermudaBhutanBoliviaBosnia and HerzegovinaBotswanaBrazilBritish Virgin IslandsBrunei DarussalamBurkina FasoBurundiCabo VerdeCambodiaCameroonCaribbean small statesCayman IslandsCentral African RepublicCentral Europe and the BalticsChadChileChinaColombiaComorosCongo, Dem. Rep.Congo, Rep.Costa RicaCote d'IvoireCroatiaCubaCyprusDjiboutiDominicaDominican RepublicEast Asia & PacificEast Asia & Pacific (excluding high income)East Asia & Pacific (IDA & IBRD countries)EcuadorEgypt, Arab Rep.El SalvadorEquatorial GuineaEritreaEthiopiaEuro areaEurope & Central AsiaEurope & Central Asia (excluding high income)Europe & Central Asia (IDA & IBRD countries)European UnionFijiFragile and conflict affected situationsFrench PolynesiaGabonGambia, TheGeorgiaGhanaGibraltarGrenadaGuatemalaGuineaGuinea-BissauGuyanaHaitiHeavily indebted poor countries (HIPC)High incomeHondurasHong Kong SAR, ChinaIBRD onlyIDA & IBRD totalIDA blendIDA onlyIDA totalIndiaIndonesiaIran, Islamic Rep.IraqIsraelJamaicaJordanKazakhstanKenyaKiribatiKorea, Dem. People’s Rep.Korea, Rep.KosovoKuwaitKyrgyz RepublicLao PDRLatin America & Caribbean Latin America & Caribbean (excluding high income)Latin America & the Caribbean (IDA & IBRD countries)Least developed countries: UN classificationLebanonLesothoLiberiaLibyaLow & middle incomeLow incomeLower middle incomeMacao SAR, ChinaMacedonia, FYRMadagascarMalawiMalaysiaMaldivesMaliMaltaMarshall IslandsMauritaniaMauritiusMexicoMicronesia, Fed. Sts.Middle East & North AfricaMiddle East & North Africa (excluding high income)Middle East & North Africa (IDA & IBRD countries)Middle incomeMoldovaMongoliaMontenegroMoroccoMozambiqueMyanmarNamibiaNauruNepalNew CaledoniaNicaraguaNigerNigeriaNorth AmericaNorthern Mariana IslandsOECD membersOmanOther small statesPacific island small statesPakistanPalauPanamaPapua New GuineaParaguayPeruPhilippinesQatarRwandaSamoaSao Tome and PrincipeSaudi ArabiaSenegalSerbiaSeychellesSierra LeoneSingaporeSloveniaSmall statesSolomon IslandsSomaliaSouth AfricaSouth AsiaSouth Asia (IDA & IBRD)South SudanSri LankaSt. Kitts and NevisSt. LuciaSt. Vincent and the GrenadinesSub-Saharan Africa Sub-Saharan Africa (excluding high income)Sub-Saharan Africa (IDA & IBRD countries)SudanSurinameSwazilandSyrian Arab RepublicTajikistanTanzaniaThailandTimor-LesteTogoTongaTrinidad and TobagoTunisiaTurkeyTurkmenistanTurks and Caicos IslandsTuvaluUgandaUkraineUnited Arab EmiratesUpper middle incomeUruguayUzbekistanVanuatuVenezuela, RBVietnamWest Bank and GazaWorldYemen, Rep.ZambiaZimbabwe Linha do tempo:
Nesta escala de tempo está apresentado um gráfico de 1961 ano até 2015 ano Guinea. Dados de 1960 ano ausente. O número de observações reais por data: 55.
Fonte (nome):
Indicadores de desenvolvimento mundial
Fonte (organização):
Development Assistance Committee of the Organisation for Economic Co-operation and Development, Geographical Distribution of Financial Flows to Developing Countries, Development Co-operation Report, and International Development Statistics database. Data are available online at: www.oecd.org/dac/stats/idsonline. World Bank population estimates are used for the denominator.
Categorias:
Aid Effectiveness, Economy & Growth, External Debt
Foi atualizado:
23 abr 2017 ano
Indicadores de alterações dos valores ao longo dos anos
Mínimo:
0.045
1 jan 1961 ano
Máximo:
66.25
1 jan 1993 ano
Na data de observação
Valor
Mudança absoluta
A alteração em relação ao valor anterior
1 jan 1961 ano
0.045
+0.045
0.0%
1 jan 1962 ano
0.696
+0.652
1.46 mil%
1 jan 1963 ano
2.761
+2.065
296.53%
1 jan 1964 ano
6.213
+3.453
125.06%
1 jan 1965 ano
3.709
-2.504
-40.3%
1 jan 1966 ano
6.194
+2.485
66.99%
1 jan 1967 ano
3.645
-2.55
-41.16%
1 jan 1968 ano
1.989
-1.656
-45.42%
1 jan 1969 ano
1.49
-0.499
-25.1%
1 jan 1970 ano
3.228
+1.738
116.68%
1 jan 1971 ano
2.432
-0.797
-24.68%
1 jan 1972 ano
2.242
-0.189
-7.78%
1 jan 1973 ano
1.116
-1.127
-50.24%
1 jan 1974 ano
2.598
+1.482
132.81%
1 jan 1975 ano
4.564
+1.966
75.7%
1 jan 1976 ano
5.59
+1.026
22.48%
1 jan 1977 ano
2.378
-3.211
-57.45%
1 jan 1978 ano
5.144
+2.765
116.27%
1 jan 1979 ano
13.428
+8.284
161.05%
1 jan 1980 ano
12.48
-0.948
-7.06%
1 jan 1981 ano
19.676
+7.196
57.66%
1 jan 1982 ano
23.234
+3.558
18.08%
1 jan 1983 ano
24.651
+1.417
6.1%
1 jan 1984 ano
13.836
-10.815
-43.87%
1 jan 1985 ano
24.35
+10.513
75.98%
1 jan 1986 ano
22.234
-2.116
-8.69%
1 jan 1987 ano
32.214
+9.98
44.88%
1 jan 1988 ano
41.08
+8.867
27.52%
1 jan 1989 ano
45.953
+4.873
11.86%
1 jan 1990 ano
63.007
+17.054
37.11%
1 jan 1991 ano
48.322
-14.684
-23.31%
1 jan 1992 ano
59.292
+10.97
22.7%
1 jan 1993 ano
66.25
+6.958
11.73%
1 jan 1994 ano
57.337
-8.913
-13.45%
1 jan 1995 ano
47.533
-9.804
-17.1%
1 jan 1996 ano
52.896
+5.362
11.28%
1 jan 1997 ano
36.685
-16.21
-30.65%
1 jan 1998 ano
45.763
+9.078
24.75%
1 jan 1999 ano
42.292
-3.471
-7.59%
1 jan 2000 ano
27.481
-14.811
-35.02%
1 jan 2001 ano
17.38
-10.101
-36.76%
1 jan 2002 ano
32.253
+14.873
85.57%
1 jan 2003 ano
27.853
-4.4
-13.64%
1 jan 2004 ano
27.402
-0.451
-1.62%
1 jan 2005 ano
29.428
+2.026
7.4%
1 jan 2006 ano
20.496
-8.932
-30.35%
1 jan 2007 ano
17.13
-3.366
-16.42%
1 jan 2008 ano
22.459
+5.329
31.11%
1 jan 2009 ano
31.484
+9.025
40.18%
1 jan 2010 ano
20.002
-11.482
-36.47%
1 jan 2011 ano
19.777
-0.226
-1.13%
1 jan 2012 ano
17.994
-1.782
-9.01%
1 jan 2013 ano
29.204
+11.21
62.3%
1 jan 2014 ano
39.551
+10.346
35.43%
1 jan 2015 ano
45.7
+6.149
15.55%
Classificação de países por estatísticas atuais por anos


Comentários: