29
/pt/
pt
AIzaSyAYiBZKx7MnpbEhh9jyipgxe19OcubqV5w
April 1, 2024
213909
Northern Mariana Islands
MNP
true
2
1
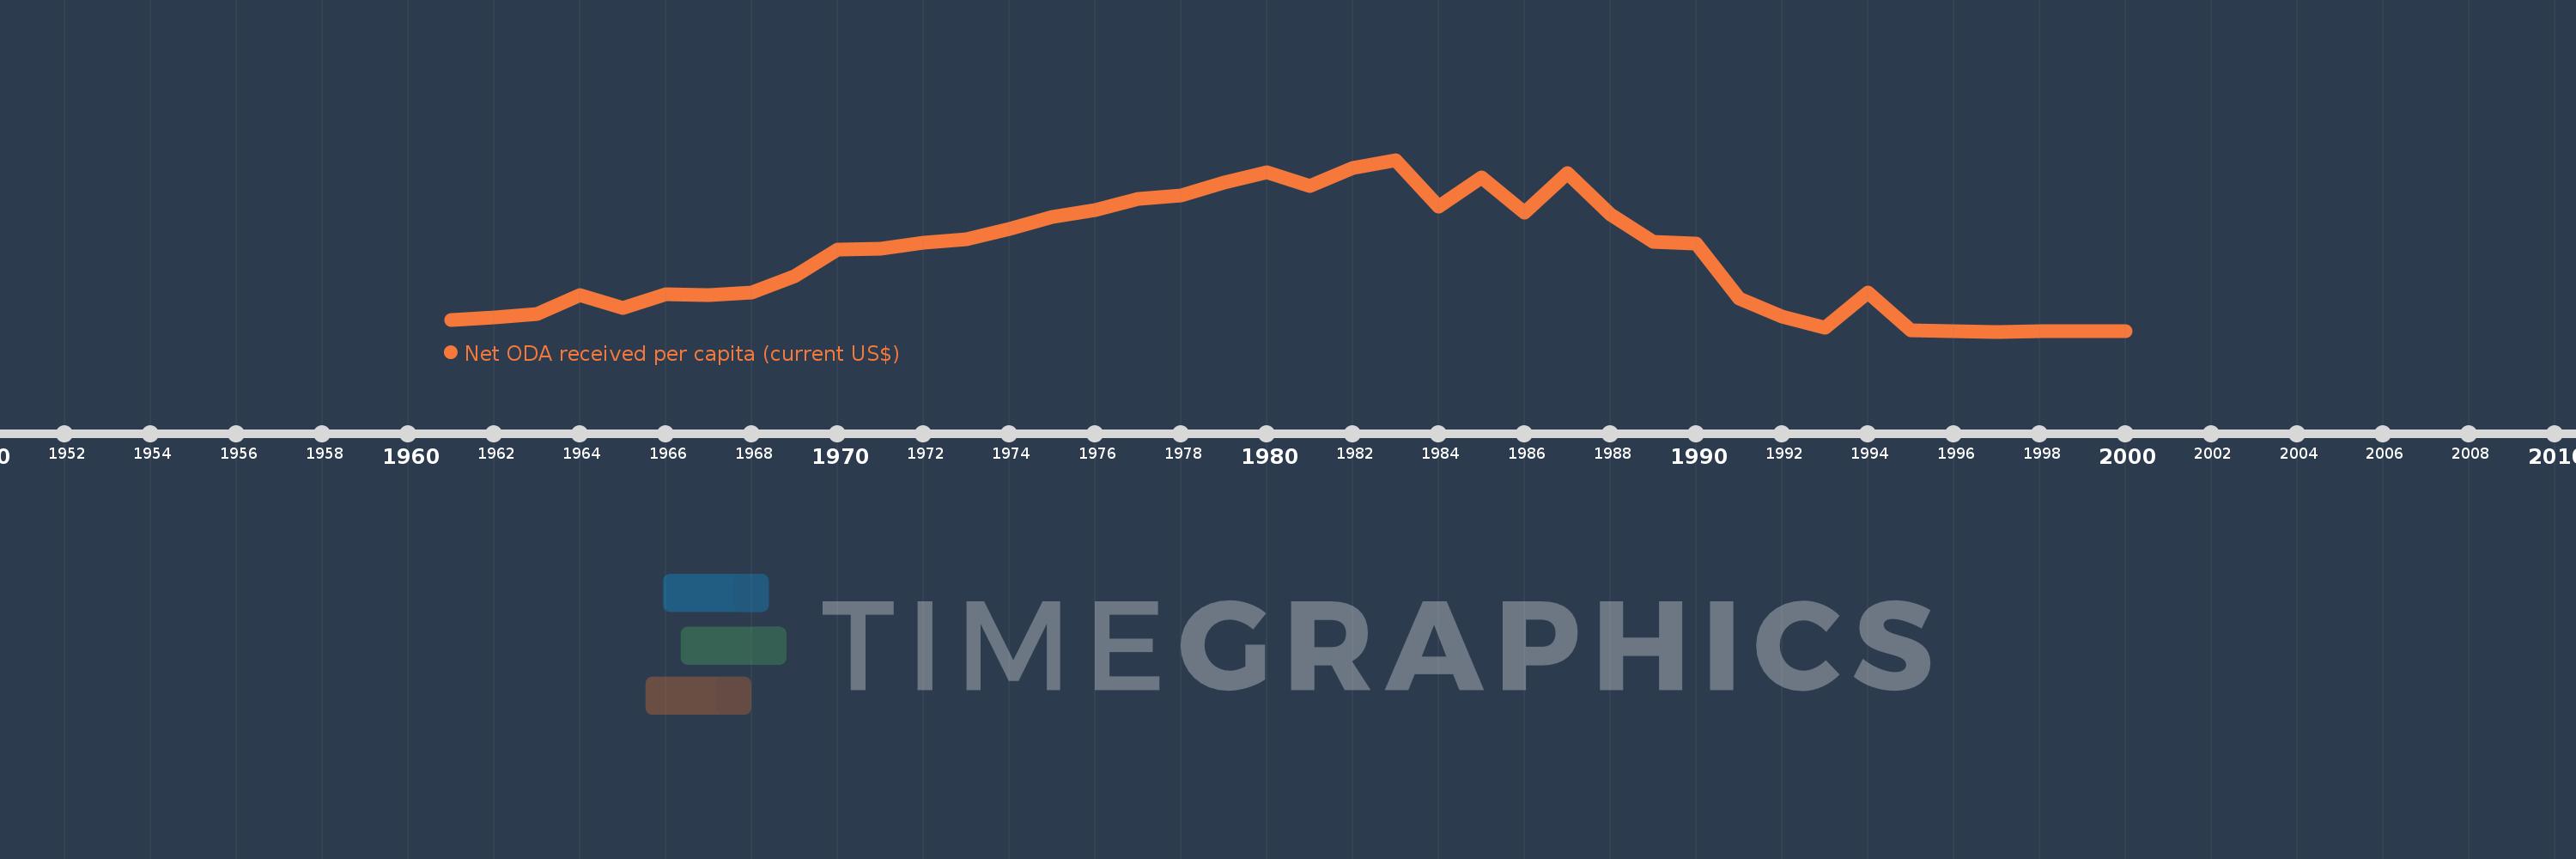
Net ODA received per capita (current US$)
2000,1999,1998,1997,1996,1995,1994,1993,1992,1991,1990,1989,1988,1987,1986,1985,1984,1983,1982,1981,1980,1979,1978,1977,1976,1975,1974,1973,1972,1971,1970,1969,1968,1967,1966,1965,1964,1963,1962,1961
Estas estatísticas em outros países:
AfghanistanAlbaniaAlgeriaAngolaAntigua and BarbudaArab WorldArgentinaArmeniaArubaAzerbaijanBahamas, TheBahrainBangladeshBarbadosBelarusBelizeBeninBermudaBhutanBoliviaBosnia and HerzegovinaBotswanaBrazilBritish Virgin IslandsBrunei DarussalamBurkina FasoBurundiCabo VerdeCambodiaCameroonCaribbean small statesCayman IslandsCentral African RepublicCentral Europe and the BalticsChadChileChinaColombiaComorosCongo, Dem. Rep.Congo, Rep.Costa RicaCote d'IvoireCroatiaCubaCyprusDjiboutiDominicaDominican RepublicEast Asia & PacificEast Asia & Pacific (excluding high income)East Asia & Pacific (IDA & IBRD countries)EcuadorEgypt, Arab Rep.El SalvadorEquatorial GuineaEritreaEthiopiaEuro areaEurope & Central AsiaEurope & Central Asia (excluding high income)Europe & Central Asia (IDA & IBRD countries)European UnionFijiFragile and conflict affected situationsFrench PolynesiaGabonGambia, TheGeorgiaGhanaGibraltarGrenadaGuatemalaGuineaGuinea-BissauGuyanaHaitiHeavily indebted poor countries (HIPC)High incomeHondurasHong Kong SAR, ChinaIBRD onlyIDA & IBRD totalIDA blendIDA onlyIDA totalIndiaIndonesiaIran, Islamic Rep.IraqIsraelJamaicaJordanKazakhstanKenyaKiribatiKorea, Dem. People’s Rep.Korea, Rep.KosovoKuwaitKyrgyz RepublicLao PDRLatin America & Caribbean Latin America & Caribbean (excluding high income)Latin America & the Caribbean (IDA & IBRD countries)Least developed countries: UN classificationLebanonLesothoLiberiaLibyaLow & middle incomeLow incomeLower middle incomeMacao SAR, ChinaMacedonia, FYRMadagascarMalawiMalaysiaMaldivesMaliMaltaMarshall IslandsMauritaniaMauritiusMexicoMicronesia, Fed. Sts.Middle East & North AfricaMiddle East & North Africa (excluding high income)Middle East & North Africa (IDA & IBRD countries)Middle incomeMoldovaMongoliaMontenegroMoroccoMozambiqueMyanmarNamibiaNauruNepalNew CaledoniaNicaraguaNigerNigeriaNorth AmericaNorthern Mariana IslandsOECD membersOmanOther small statesPacific island small statesPakistanPalauPanamaPapua New GuineaParaguayPeruPhilippinesQatarRwandaSamoaSao Tome and PrincipeSaudi ArabiaSenegalSerbiaSeychellesSierra LeoneSingaporeSloveniaSmall statesSolomon IslandsSomaliaSouth AfricaSouth AsiaSouth Asia (IDA & IBRD)South SudanSri LankaSt. Kitts and NevisSt. LuciaSt. Vincent and the GrenadinesSub-Saharan Africa Sub-Saharan Africa (excluding high income)Sub-Saharan Africa (IDA & IBRD countries)SudanSurinameSwazilandSyrian Arab RepublicTajikistanTanzaniaThailandTimor-LesteTogoTongaTrinidad and TobagoTunisiaTurkeyTurkmenistanTurks and Caicos IslandsTuvaluUgandaUkraineUnited Arab EmiratesUpper middle incomeUruguayUzbekistanVanuatuVenezuela, RBVietnamWest Bank and GazaWorldYemen, Rep.ZambiaZimbabwe Linha do tempo:
Nesta escala de tempo está apresentado um gráfico de 1961 ano até 2000 ano Northern Mariana Islands. Dados de 1960 ano ausente. O número de observações reais por data: 40.
Fonte (nome):
Indicadores de desenvolvimento mundial
Fonte (organização):
Development Assistance Committee of the Organisation for Economic Co-operation and Development, Geographical Distribution of Financial Flows to Developing Countries, Development Co-operation Report, and International Development Statistics database. Data are available online at: www.oecd.org/dac/stats/idsonline. World Bank population estimates are used for the denominator.
Categorias:
Aid Effectiveness, Economy & Growth, External Debt
Foi atualizado:
23 abr 2017 ano
Indicadores de alterações dos valores ao longo dos anos
Mínimo:
-26.059
1 jan 1997 ano
Máximo:
7.565 mil
1 jan 1983 ano
Na data de observação
Valor
Mudança absoluta
A alteração em relação ao valor anterior
1 jan 1961 ano
496.524
+496.524
0.0%
1 jan 1962 ano
581.238
+84.714
17.06%
1 jan 1963 ano
760.839
+179.601
30.9%
1 jan 1964 ano
1.588 mil
+827.545
108.77%
1 jan 1965 ano
1.016 mil
-571.963
-36.01%
1 jan 1966 ano
1.632 mil
+615.739
60.58%
1 jan 1967 ano
1.574 mil
-58.48
-3.58%
1 jan 1968 ano
1.702 mil
+128.055
8.14%
1 jan 1969 ano
2.428 mil
+726.42
42.69%
1 jan 1970 ano
3.612 mil
+1.184 mil
48.75%
1 jan 1971 ano
3.65 mil
+37.99
1.05%
1 jan 1972 ano
3.9 mil
+249.618
6.84%
1 jan 1973 ano
4.045 mil
+145.851
3.74%
1 jan 1974 ano
4.492 mil
+446.9
11.05%
1 jan 1975 ano
5.026 mil
+533.741
11.88%
1 jan 1976 ano
5.339 mil
+313.379
6.24%
1 jan 1977 ano
5.848 mil
+508.716
9.53%
1 jan 1978 ano
5.99 mil
+142.19
2.43%
1 jan 1979 ano
6.576 mil
+586.026
9.78%
1 jan 1980 ano
7.021 mil
+444.273
6.76%
1 jan 1981 ano
6.402 mil
-618.697
-8.81%
1 jan 1982 ano
7.209 mil
+806.899
12.6%
1 jan 1983 ano
7.565 mil
+356.269
4.94%
1 jan 1984 ano
5.507 mil
-2.058 mil
-27.21%
1 jan 1985 ano
6.769 mil
+1.263 mil
22.93%
1 jan 1986 ano
5.24 mil
-1.53 mil
-22.6%
1 jan 1987 ano
6.995 mil
+1.756 mil
33.51%
1 jan 1988 ano
5.16 mil
-1.835 mil
-26.23%
1 jan 1989 ano
3.946 mil
-1.214 mil
-23.53%
1 jan 1990 ano
3.849 mil
-97.193
-2.46%
1 jan 1991 ano
1.435 mil
-2.414 mil
-62.71%
1 jan 1992 ano
623.729
-811.502
-56.54%
1 jan 1993 ano
149.507
-474.222
-76.03%
1 jan 1994 ano
1.707 mil
+1.557 mil
1.04 mil%
1 jan 1995 ano
41.958
-1.665 mil
-97.54%
1 jan 1996 ano
-12.17
-54.128
-129.01%
1 jan 1997 ano
-26.059
-13.889
114.12%
1 jan 1998 ano
10.963
+37.022
-142.07%
1 jan 1999 ano
3.059
-7.904
-72.09%
1 jan 2000 ano
1.784
-1.275
-41.69%
Classificação de países por estatísticas atuais por anos


Comentários: