29
/pt/
pt
AIzaSyAYiBZKx7MnpbEhh9jyipgxe19OcubqV5w
April 1, 2024
280136
Vanuatu
VUT
true
2
1
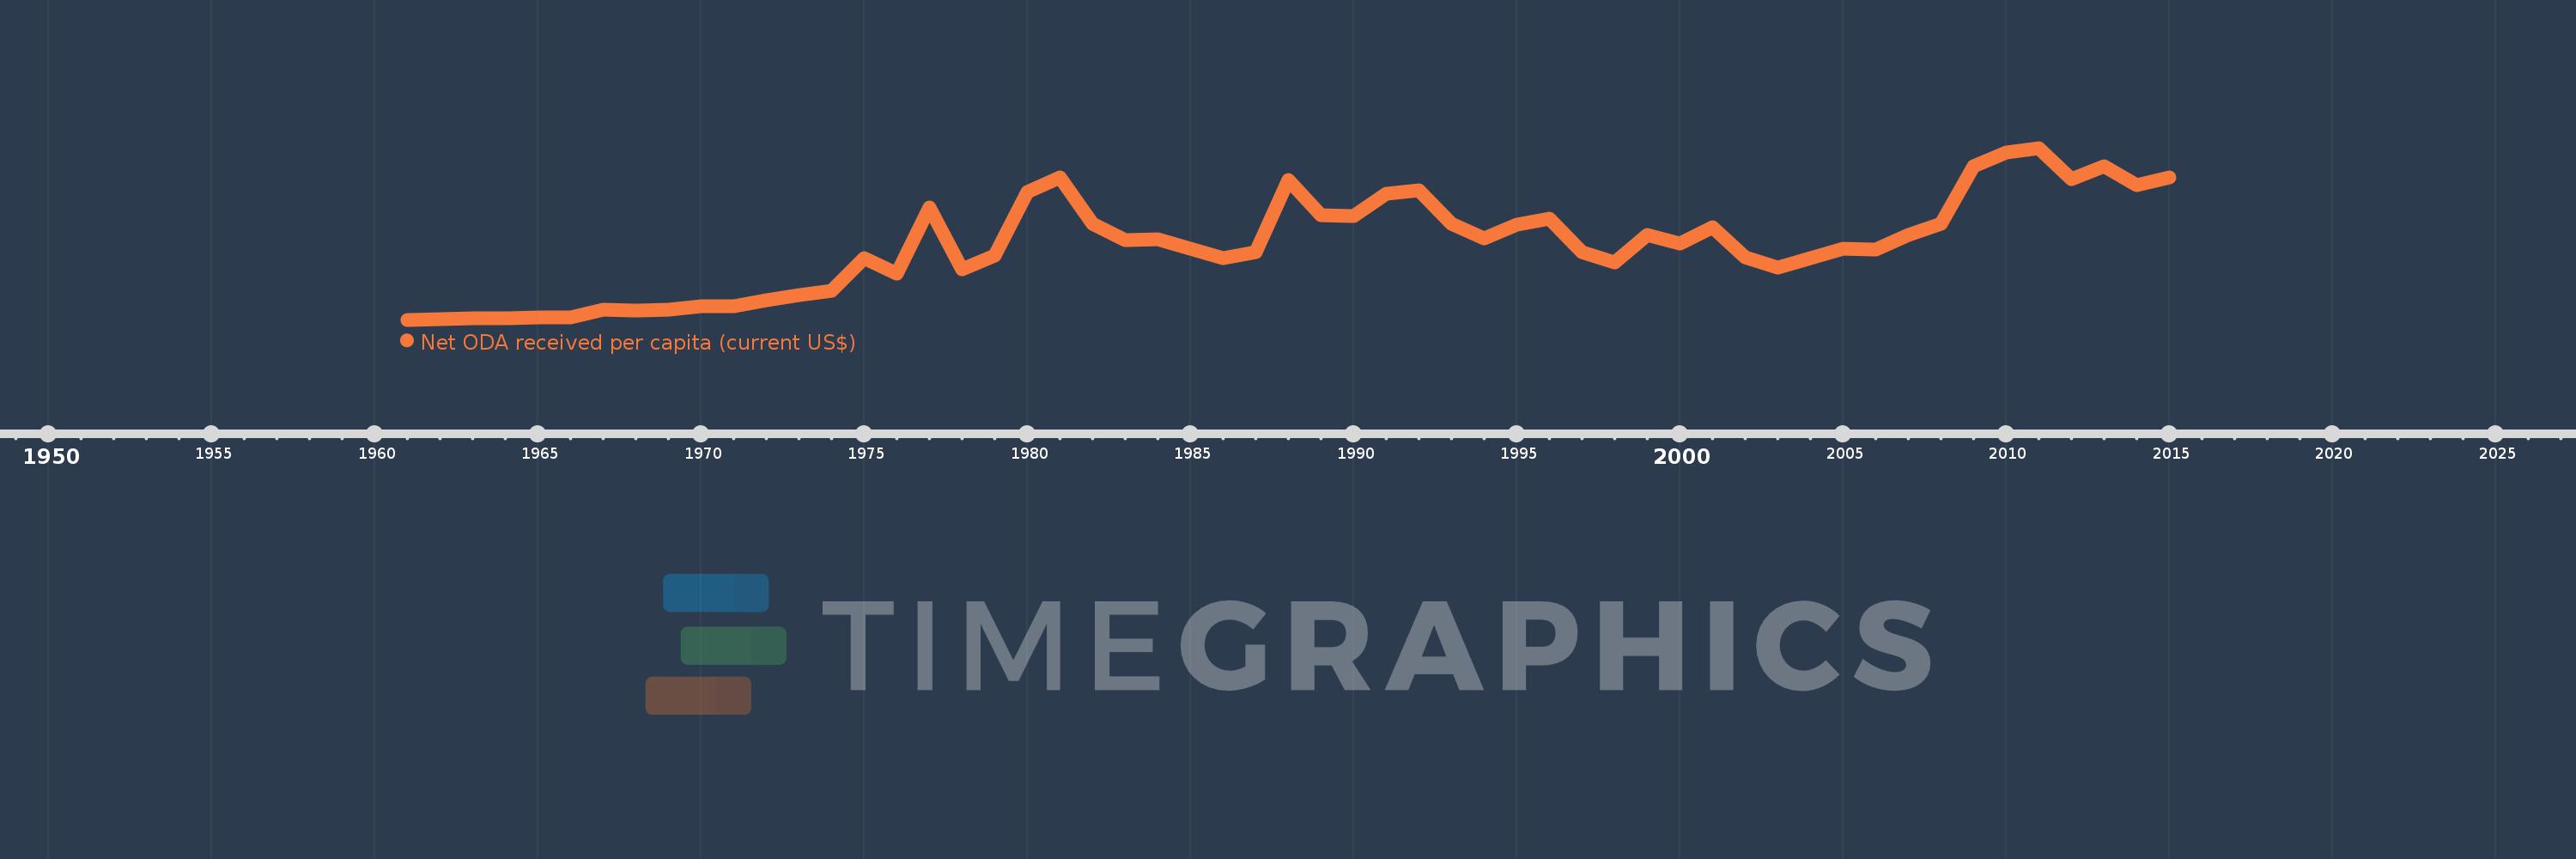
Net ODA received per capita (current US$)
2015,2014,2013,2012,2011,2010,2009,2008,2007,2006,2005,2004,2003,2002,2001,2000,1999,1998,1997,1996,1995,1994,1993,1992,1991,1990,1989,1988,1987,1986,1985,1984,1983,1982,1981,1980,1979,1978,1977,1976,1975,1974,1973,1972,1971,1970,1969,1968,1967,1966,1965,1964,1963,1962,1961
Estas estatísticas em outros países:
AfghanistanAlbaniaAlgeriaAngolaAntigua and BarbudaArab WorldArgentinaArmeniaArubaAzerbaijanBahamas, TheBahrainBangladeshBarbadosBelarusBelizeBeninBermudaBhutanBoliviaBosnia and HerzegovinaBotswanaBrazilBritish Virgin IslandsBrunei DarussalamBurkina FasoBurundiCabo VerdeCambodiaCameroonCaribbean small statesCayman IslandsCentral African RepublicCentral Europe and the BalticsChadChileChinaColombiaComorosCongo, Dem. Rep.Congo, Rep.Costa RicaCote d'IvoireCroatiaCubaCyprusDjiboutiDominicaDominican RepublicEast Asia & PacificEast Asia & Pacific (excluding high income)East Asia & Pacific (IDA & IBRD countries)EcuadorEgypt, Arab Rep.El SalvadorEquatorial GuineaEritreaEthiopiaEuro areaEurope & Central AsiaEurope & Central Asia (excluding high income)Europe & Central Asia (IDA & IBRD countries)European UnionFijiFragile and conflict affected situationsFrench PolynesiaGabonGambia, TheGeorgiaGhanaGibraltarGrenadaGuatemalaGuineaGuinea-BissauGuyanaHaitiHeavily indebted poor countries (HIPC)High incomeHondurasHong Kong SAR, ChinaIBRD onlyIDA & IBRD totalIDA blendIDA onlyIDA totalIndiaIndonesiaIran, Islamic Rep.IraqIsraelJamaicaJordanKazakhstanKenyaKiribatiKorea, Dem. People’s Rep.Korea, Rep.KosovoKuwaitKyrgyz RepublicLao PDRLatin America & Caribbean Latin America & Caribbean (excluding high income)Latin America & the Caribbean (IDA & IBRD countries)Least developed countries: UN classificationLebanonLesothoLiberiaLibyaLow & middle incomeLow incomeLower middle incomeMacao SAR, ChinaMacedonia, FYRMadagascarMalawiMalaysiaMaldivesMaliMaltaMarshall IslandsMauritaniaMauritiusMexicoMicronesia, Fed. Sts.Middle East & North AfricaMiddle East & North Africa (excluding high income)Middle East & North Africa (IDA & IBRD countries)Middle incomeMoldovaMongoliaMontenegroMoroccoMozambiqueMyanmarNamibiaNauruNepalNew CaledoniaNicaraguaNigerNigeriaNorth AmericaNorthern Mariana IslandsOECD membersOmanOther small statesPacific island small statesPakistanPalauPanamaPapua New GuineaParaguayPeruPhilippinesQatarRwandaSamoaSao Tome and PrincipeSaudi ArabiaSenegalSerbiaSeychellesSierra LeoneSingaporeSloveniaSmall statesSolomon IslandsSomaliaSouth AfricaSouth AsiaSouth Asia (IDA & IBRD)South SudanSri LankaSt. Kitts and NevisSt. LuciaSt. Vincent and the GrenadinesSub-Saharan Africa Sub-Saharan Africa (excluding high income)Sub-Saharan Africa (IDA & IBRD countries)SudanSurinameSwazilandSyrian Arab RepublicTajikistanTanzaniaThailandTimor-LesteTogoTongaTrinidad and TobagoTunisiaTurkeyTurkmenistanTurks and Caicos IslandsTuvaluUgandaUkraineUnited Arab EmiratesUpper middle incomeUruguayUzbekistanVanuatuVenezuela, RBVietnamWest Bank and GazaWorldYemen, Rep.ZambiaZimbabwe Linha do tempo:
Nesta escala de tempo está apresentado um gráfico de 1961 ano até 2015 ano Vanuatu. Dados de 1960 ano ausente. O número de observações reais por data: 55.
Fonte (nome):
Indicadores de desenvolvimento mundial
Fonte (organização):
Development Assistance Committee of the Organisation for Economic Co-operation and Development, Geographical Distribution of Financial Flows to Developing Countries, Development Co-operation Report, and International Development Statistics database. Data are available online at: www.oecd.org/dac/stats/idsonline. World Bank population estimates are used for the denominator.
Categorias:
Aid Effectiveness, Economy & Growth, External Debt
Foi atualizado:
23 abr 2017 ano
Indicadores de alterações dos valores ao longo dos anos
Mínimo:
2.355
1 jan 1961 ano
Máximo:
458.106
1 jan 2011 ano
Na data de observação
Valor
Mudança absoluta
A alteração em relação ao valor anterior
1 jan 1961 ano
2.355
+2.355
0.0%
1 jan 1962 ano
4.261
+1.907
80.97%
1 jan 1963 ano
6.047
+1.785
41.9%
1 jan 1964 ano
7.29
+1.243
20.56%
1 jan 1965 ano
9.011
+1.722
23.62%
1 jan 1966 ano
7.808
-1.204
-13.36%
1 jan 1967 ano
28.399
+20.592
263.74%
1 jan 1968 ano
25.599
-2.8
-9.86%
1 jan 1969 ano
28.883
+3.284
12.83%
1 jan 1970 ano
38.823
+9.939
34.41%
1 jan 1971 ano
37.827
-0.995
-2.56%
1 jan 1972 ano
54.531
+16.704
44.16%
1 jan 1973 ano
67.823
+13.292
24.38%
1 jan 1974 ano
79.351
+11.527
17.0%
1 jan 1975 ano
166.644
+87.294
110.01%
1 jan 1976 ano
124.951
-41.693
-25.02%
1 jan 1977 ano
300.221
+175.27
140.27%
1 jan 1978 ano
136.976
-163.245
-54.37%
1 jan 1979 ano
171.618
+34.642
25.29%
1 jan 1980 ano
340.383
+168.765
98.34%
1 jan 1981 ano
380.338
+39.955
11.74%
1 jan 1982 ano
256.203
-124.135
-32.64%
1 jan 1983 ano
213.039
-43.163
-16.85%
1 jan 1984 ano
215.456
+2.417
1.13%
1 jan 1985 ano
190.961
-24.495
-11.37%
1 jan 1986 ano
166.349
-24.612
-12.89%
1 jan 1987 ano
182.426
+16.078
9.66%
1 jan 1988 ano
373.837
+191.41
104.92%
1 jan 1989 ano
279.33
-94.506
-25.28%
1 jan 1990 ano
276.58
-2.75
-0.98%
1 jan 1991 ano
337.782
+61.202
22.13%
1 jan 1992 ano
346.467
+8.685
2.57%
1 jan 1993 ano
256.567
-89.9
-25.95%
1 jan 1994 ano
218.879
-37.688
-14.69%
1 jan 1995 ano
254.066
+35.187
16.08%
1 jan 1996 ano
270.929
+16.862
6.64%
1 jan 1997 ano
180.848
-90.081
-33.25%
1 jan 1998 ano
155.196
-25.651
-14.18%
1 jan 1999 ano
228.22
+73.023
47.05%
1 jan 2000 ano
205.188
-23.032
-10.09%
1 jan 2001 ano
247.49
+42.302
20.62%
1 jan 2002 ano
167.523
-79.967
-32.31%
1 jan 2003 ano
141.681
-25.842
-15.43%
1 jan 2004 ano
164.905
+23.224
16.39%
1 jan 2005 ano
189.768
+24.863
15.08%
1 jan 2006 ano
188.561
-1.207
-0.64%
1 jan 2007 ano
227.316
+38.755
20.55%
1 jan 2008 ano
257.733
+30.417
13.38%
1 jan 2009 ano
409.479
+151.746
58.88%
1 jan 2010 ano
447.132
+37.653
9.2%
1 jan 2011 ano
458.106
+10.974
2.45%
1 jan 2012 ano
374.903
-83.203
-18.16%
1 jan 2013 ano
409.781
+34.878
9.3%
1 jan 2014 ano
359.015
-50.766
-12.39%
1 jan 2015 ano
380.056
+21.041
5.86%
Classificação de países por estatísticas atuais por anos


Comentários: