29
/pt/
pt
AIzaSyAYiBZKx7MnpbEhh9jyipgxe19OcubqV5w
April 1, 2024
168863
Kiribati
KIR
true
2
1
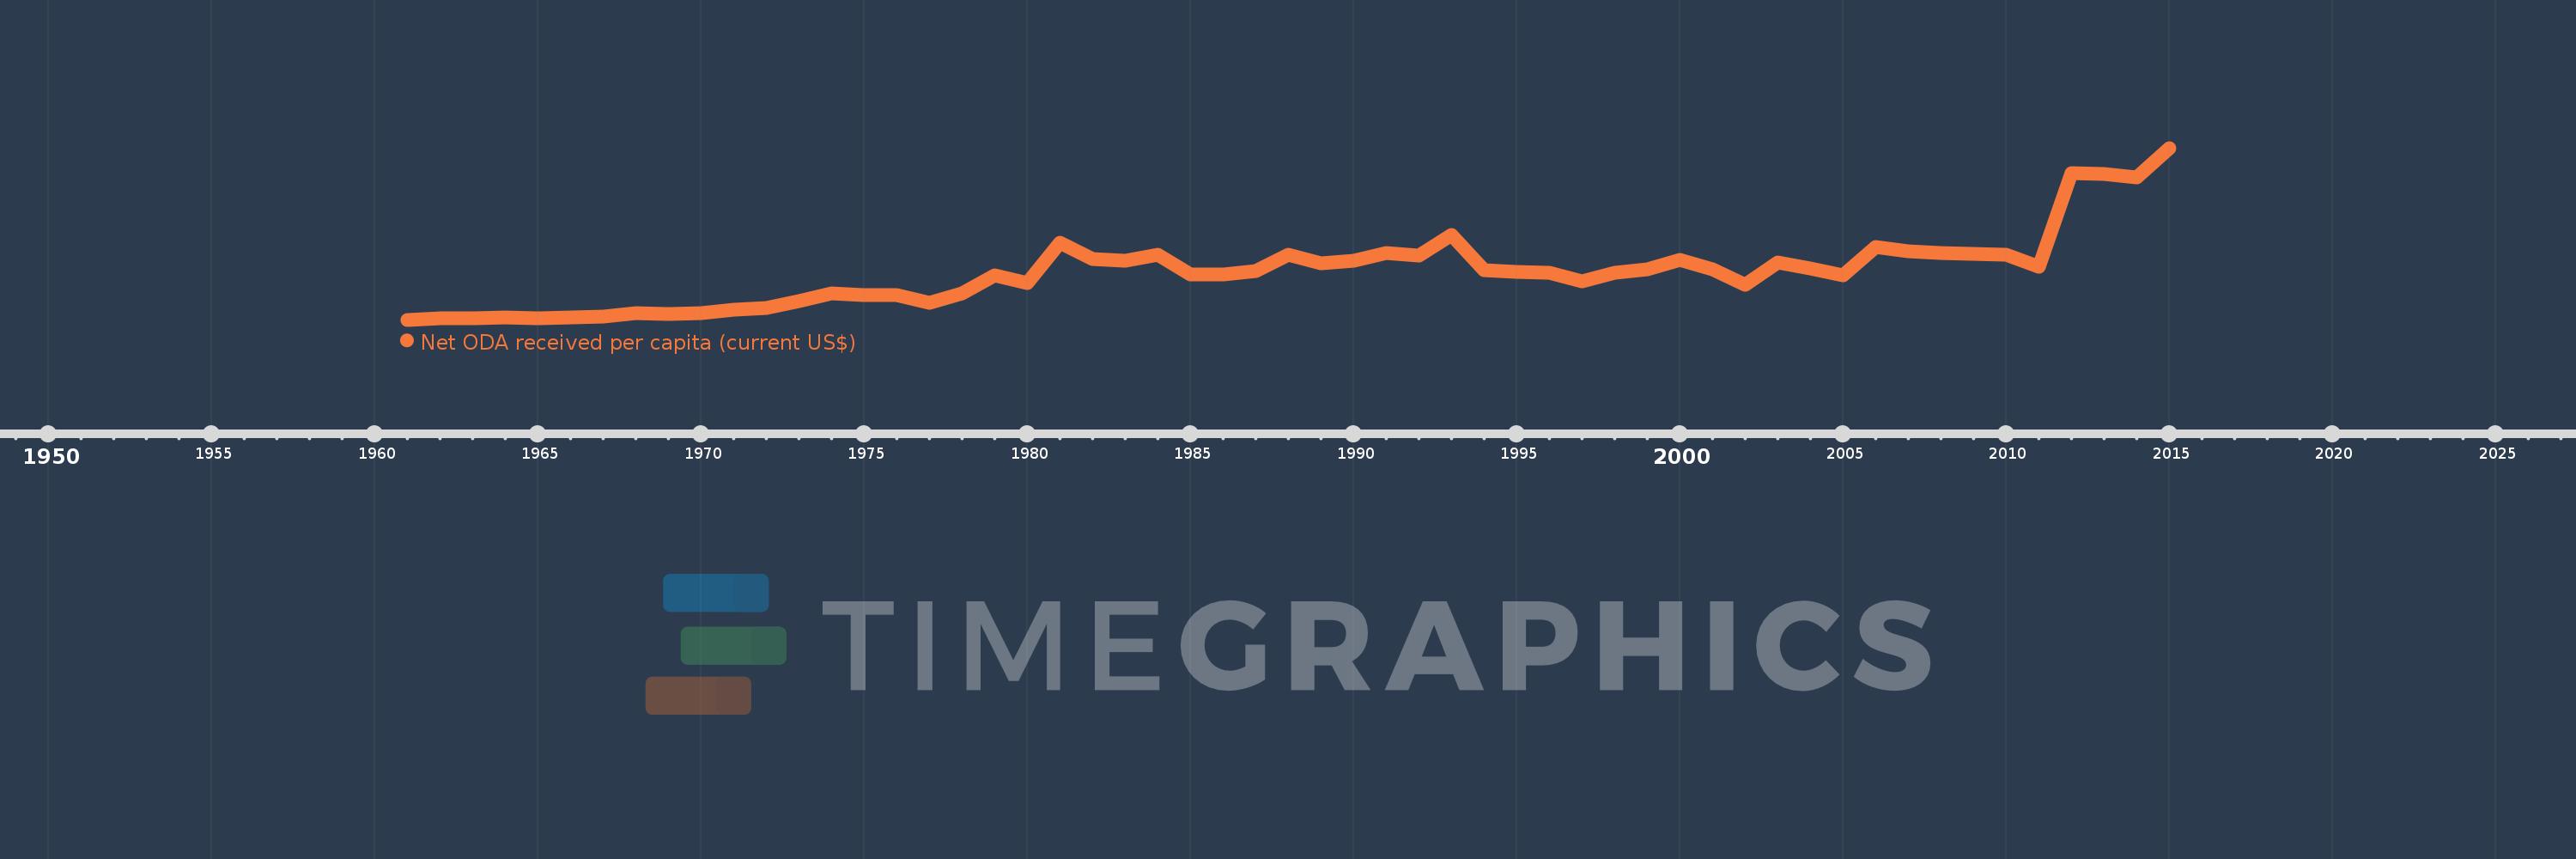
Net ODA received per capita (current US$)
2015,2014,2013,2012,2011,2010,2009,2008,2007,2006,2005,2004,2003,2002,2001,2000,1999,1998,1997,1996,1995,1994,1993,1992,1991,1990,1989,1988,1987,1986,1985,1984,1983,1982,1981,1980,1979,1978,1977,1976,1975,1974,1973,1972,1971,1970,1969,1968,1967,1966,1965,1964,1963,1962,1961
Estas estatísticas em outros países:
AfghanistanAlbaniaAlgeriaAngolaAntigua and BarbudaArab WorldArgentinaArmeniaArubaAzerbaijanBahamas, TheBahrainBangladeshBarbadosBelarusBelizeBeninBermudaBhutanBoliviaBosnia and HerzegovinaBotswanaBrazilBritish Virgin IslandsBrunei DarussalamBurkina FasoBurundiCabo VerdeCambodiaCameroonCaribbean small statesCayman IslandsCentral African RepublicCentral Europe and the BalticsChadChileChinaColombiaComorosCongo, Dem. Rep.Congo, Rep.Costa RicaCote d'IvoireCroatiaCubaCyprusDjiboutiDominicaDominican RepublicEast Asia & PacificEast Asia & Pacific (excluding high income)East Asia & Pacific (IDA & IBRD countries)EcuadorEgypt, Arab Rep.El SalvadorEquatorial GuineaEritreaEthiopiaEuro areaEurope & Central AsiaEurope & Central Asia (excluding high income)Europe & Central Asia (IDA & IBRD countries)European UnionFijiFragile and conflict affected situationsFrench PolynesiaGabonGambia, TheGeorgiaGhanaGibraltarGrenadaGuatemalaGuineaGuinea-BissauGuyanaHaitiHeavily indebted poor countries (HIPC)High incomeHondurasHong Kong SAR, ChinaIBRD onlyIDA & IBRD totalIDA blendIDA onlyIDA totalIndiaIndonesiaIran, Islamic Rep.IraqIsraelJamaicaJordanKazakhstanKenyaKiribatiKorea, Dem. People’s Rep.Korea, Rep.KosovoKuwaitKyrgyz RepublicLao PDRLatin America & Caribbean Latin America & Caribbean (excluding high income)Latin America & the Caribbean (IDA & IBRD countries)Least developed countries: UN classificationLebanonLesothoLiberiaLibyaLow & middle incomeLow incomeLower middle incomeMacao SAR, ChinaMacedonia, FYRMadagascarMalawiMalaysiaMaldivesMaliMaltaMarshall IslandsMauritaniaMauritiusMexicoMicronesia, Fed. Sts.Middle East & North AfricaMiddle East & North Africa (excluding high income)Middle East & North Africa (IDA & IBRD countries)Middle incomeMoldovaMongoliaMontenegroMoroccoMozambiqueMyanmarNamibiaNauruNepalNew CaledoniaNicaraguaNigerNigeriaNorth AmericaNorthern Mariana IslandsOECD membersOmanOther small statesPacific island small statesPakistanPalauPanamaPapua New GuineaParaguayPeruPhilippinesQatarRwandaSamoaSao Tome and PrincipeSaudi ArabiaSenegalSerbiaSeychellesSierra LeoneSingaporeSloveniaSmall statesSolomon IslandsSomaliaSouth AfricaSouth AsiaSouth Asia (IDA & IBRD)South SudanSri LankaSt. Kitts and NevisSt. LuciaSt. Vincent and the GrenadinesSub-Saharan Africa Sub-Saharan Africa (excluding high income)Sub-Saharan Africa (IDA & IBRD countries)SudanSurinameSwazilandSyrian Arab RepublicTajikistanTanzaniaThailandTimor-LesteTogoTongaTrinidad and TobagoTunisiaTurkeyTurkmenistanTurks and Caicos IslandsTuvaluUgandaUkraineUnited Arab EmiratesUpper middle incomeUruguayUzbekistanVanuatuVenezuela, RBVietnamWest Bank and GazaWorldYemen, Rep.ZambiaZimbabwe Linha do tempo:
Nesta escala de tempo está apresentado um gráfico de 1961 ano até 2015 ano Kiribati. Dados de 1960 ano ausente. O número de observações reais por data: 55.
Fonte (nome):
Indicadores de desenvolvimento mundial
Fonte (organização):
Development Assistance Committee of the Organisation for Economic Co-operation and Development, Geographical Distribution of Financial Flows to Developing Countries, Development Co-operation Report, and International Development Statistics database. Data are available online at: www.oecd.org/dac/stats/idsonline. World Bank population estimates are used for the denominator.
Categorias:
Aid Effectiveness, Economy & Growth, External Debt
Foi atualizado:
23 abr 2017 ano
Indicadores de alterações dos valores ao longo dos anos
Mínimo:
0.485
1 jan 1961 ano
Máximo:
716.122
1 jan 2015 ano
Na data de observação
Valor
Mudança absoluta
A alteração em relação ao valor anterior
1 jan 1961 ano
0.485
+0.485
0.0%
1 jan 1962 ano
6.152
+5.667
1.17 mil%
1 jan 1963 ano
7.388
+1.236
20.09%
1 jan 1964 ano
9.24
+1.852
25.06%
1 jan 1965 ano
6.164
-3.076
-33.29%
1 jan 1966 ano
9.256
+3.092
50.16%
1 jan 1967 ano
13.063
+3.807
41.13%
1 jan 1968 ano
29.521
+16.458
125.98%
1 jan 1969 ano
25.917
-3.604
-12.21%
1 jan 1970 ano
27.434
+1.517
5.85%
1 jan 1971 ano
42.594
+15.16
55.26%
1 jan 1972 ano
48.827
+6.233
14.63%
1 jan 1973 ano
79.7
+30.873
63.23%
1 jan 1974 ano
111.37
+31.67
39.74%
1 jan 1975 ano
103.159
-8.211
-7.37%
1 jan 1976 ano
102.594
-0.565
-0.55%
1 jan 1977 ano
71.99
-30.604
-29.83%
1 jan 1978 ano
108.598
+36.608
50.85%
1 jan 1979 ano
185.731
+77.133
71.03%
1 jan 1980 ano
154.848
-30.883
-16.63%
1 jan 1981 ano
322.885
+168.037
108.52%
1 jan 1982 ano
254.918
-67.967
-21.05%
1 jan 1983 ano
247.874
-7.044
-2.76%
1 jan 1984 ano
272.021
+24.147
9.74%
1 jan 1985 ano
190.224
-81.796
-30.07%
1 jan 1986 ano
187.951
-2.273
-1.2%
1 jan 1987 ano
204.216
+16.264
8.65%
1 jan 1988 ano
272.962
+68.747
33.66%
1 jan 1989 ano
233.85
-39.112
-14.33%
1 jan 1990 ano
246.25
+12.399
5.3%
1 jan 1991 ano
279.239
+32.99
13.4%
1 jan 1992 ano
268.664
-10.575
-3.79%
1 jan 1993 ano
354.941
+86.277
32.11%
1 jan 1994 ano
207.734
-147.207
-41.47%
1 jan 1995 ano
199.285
-8.448
-4.07%
1 jan 1996 ano
197.357
-1.928
-0.97%
1 jan 1997 ano
162.216
-35.141
-17.81%
1 jan 1998 ano
195.536
+33.319
20.54%
1 jan 1999 ano
212.247
+16.711
8.55%
1 jan 2000 ano
251.419
+39.172
18.46%
1 jan 2001 ano
211.715
-39.704
-15.79%
1 jan 2002 ano
144.774
-66.941
-31.62%
1 jan 2003 ano
239.058
+94.284
65.12%
1 jan 2004 ano
213.405
-25.652
-10.73%
1 jan 2005 ano
184.549
-28.856
-13.52%
1 jan 2006 ano
303.155
+118.606
64.27%
1 jan 2007 ano
284.966
-18.189
-6.0%
1 jan 2008 ano
279.929
-5.036
-1.77%
1 jan 2009 ano
275.303
-4.626
-1.65%
1 jan 2010 ano
269.873
-5.43
-1.97%
1 jan 2011 ano
222.313
-47.559
-17.62%
1 jan 2012 ano
611.397
+389.084
175.02%
1 jan 2013 ano
606.453
-4.944
-0.81%
1 jan 2014 ano
594.966
-11.487
-1.89%
1 jan 2015 ano
716.122
+121.156
20.36%
Classificação de países por estatísticas atuais por anos


Comentários: