29
/pt/
pt
AIzaSyAYiBZKx7MnpbEhh9jyipgxe19OcubqV5w
April 1, 2024
179225
Liberia
LBR
true
2
1
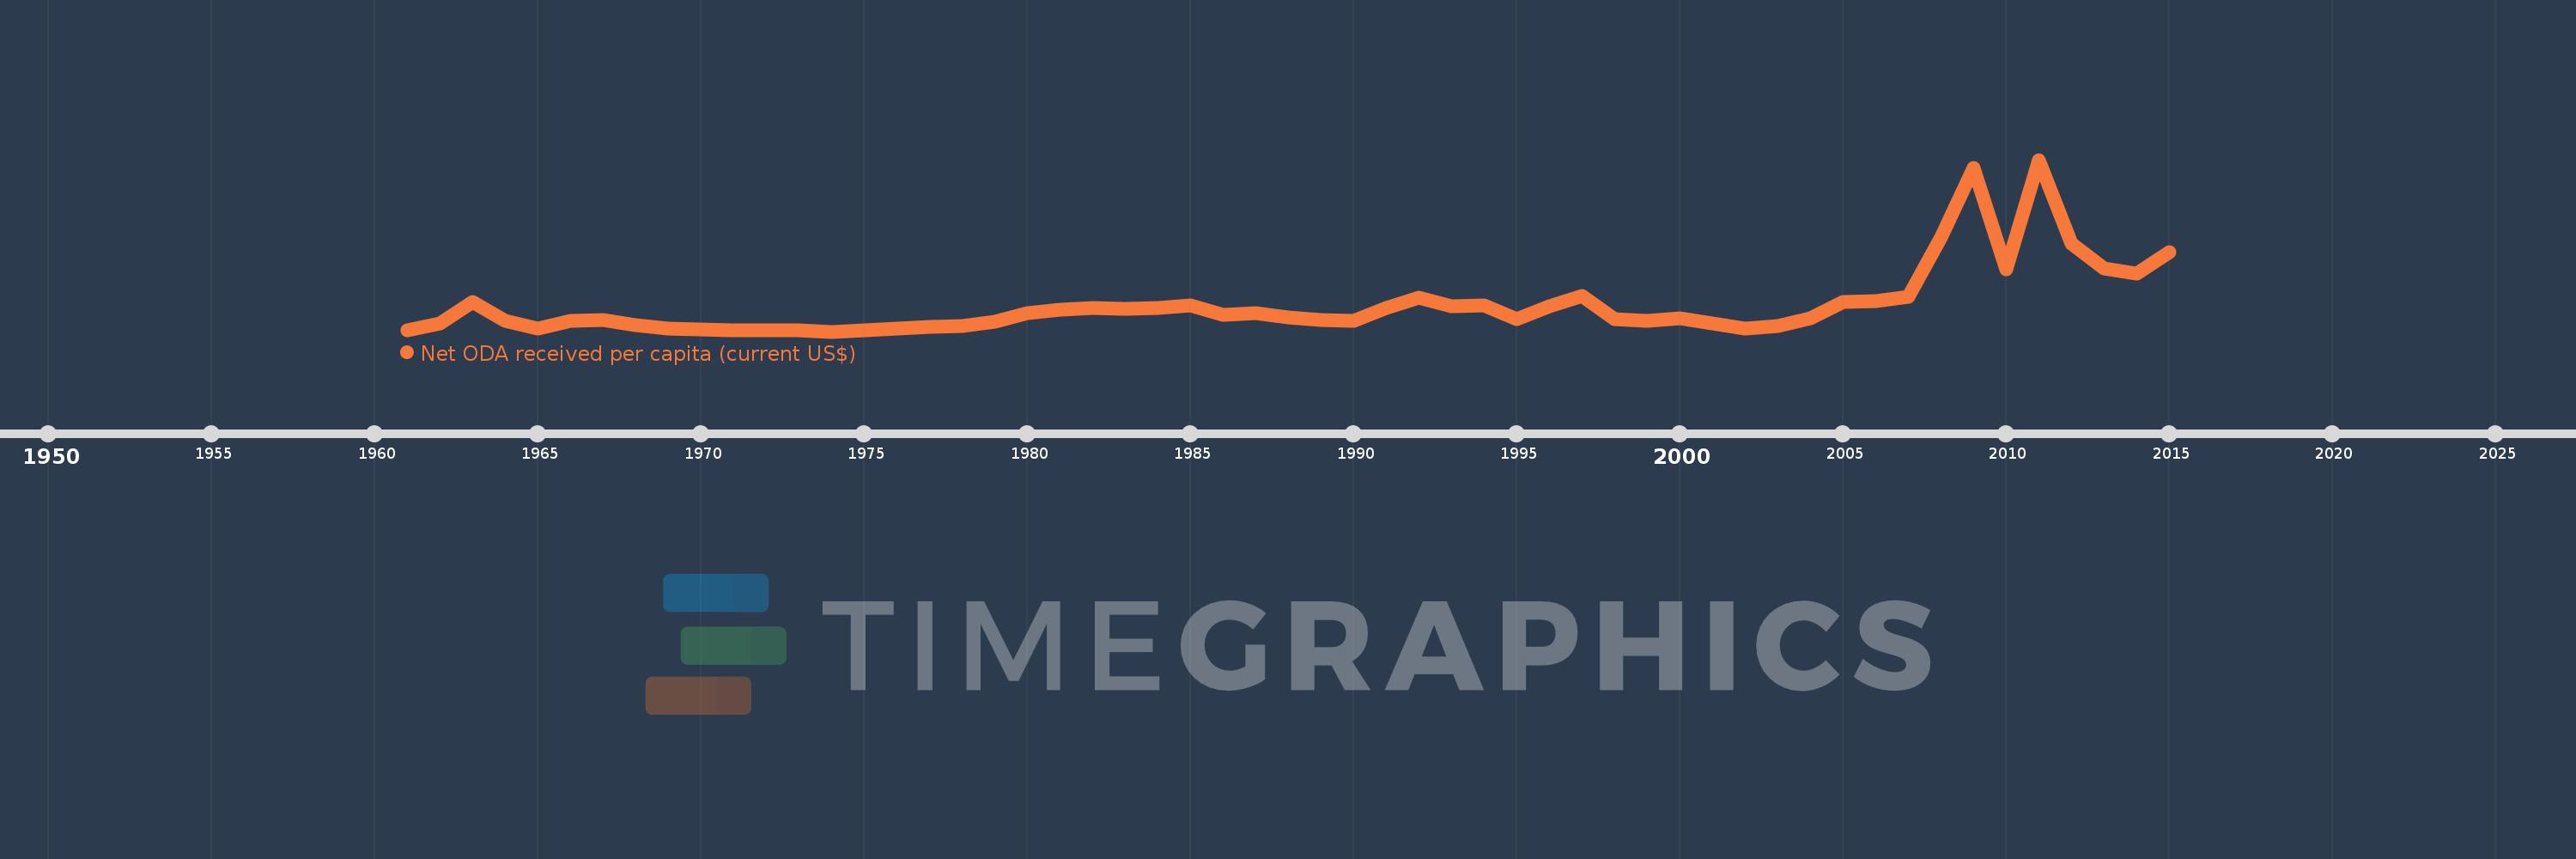
Net ODA received per capita (current US$)
2015,2014,2013,2012,2011,2010,2009,2008,2007,2006,2005,2004,2003,2002,2001,2000,1999,1998,1997,1996,1995,1994,1993,1992,1991,1990,1989,1988,1987,1986,1985,1984,1983,1982,1981,1980,1979,1978,1977,1976,1975,1974,1973,1972,1971,1970,1969,1968,1967,1966,1965,1964,1963,1962,1961
Estas estatísticas em outros países:
AfghanistanAlbaniaAlgeriaAngolaAntigua and BarbudaArab WorldArgentinaArmeniaArubaAzerbaijanBahamas, TheBahrainBangladeshBarbadosBelarusBelizeBeninBermudaBhutanBoliviaBosnia and HerzegovinaBotswanaBrazilBritish Virgin IslandsBrunei DarussalamBurkina FasoBurundiCabo VerdeCambodiaCameroonCaribbean small statesCayman IslandsCentral African RepublicCentral Europe and the BalticsChadChileChinaColombiaComorosCongo, Dem. Rep.Congo, Rep.Costa RicaCote d'IvoireCroatiaCubaCyprusDjiboutiDominicaDominican RepublicEast Asia & PacificEast Asia & Pacific (excluding high income)East Asia & Pacific (IDA & IBRD countries)EcuadorEgypt, Arab Rep.El SalvadorEquatorial GuineaEritreaEthiopiaEuro areaEurope & Central AsiaEurope & Central Asia (excluding high income)Europe & Central Asia (IDA & IBRD countries)European UnionFijiFragile and conflict affected situationsFrench PolynesiaGabonGambia, TheGeorgiaGhanaGibraltarGrenadaGuatemalaGuineaGuinea-BissauGuyanaHaitiHeavily indebted poor countries (HIPC)High incomeHondurasHong Kong SAR, ChinaIBRD onlyIDA & IBRD totalIDA blendIDA onlyIDA totalIndiaIndonesiaIran, Islamic Rep.IraqIsraelJamaicaJordanKazakhstanKenyaKiribatiKorea, Dem. People’s Rep.Korea, Rep.KosovoKuwaitKyrgyz RepublicLao PDRLatin America & Caribbean Latin America & Caribbean (excluding high income)Latin America & the Caribbean (IDA & IBRD countries)Least developed countries: UN classificationLebanonLesothoLiberiaLibyaLow & middle incomeLow incomeLower middle incomeMacao SAR, ChinaMacedonia, FYRMadagascarMalawiMalaysiaMaldivesMaliMaltaMarshall IslandsMauritaniaMauritiusMexicoMicronesia, Fed. Sts.Middle East & North AfricaMiddle East & North Africa (excluding high income)Middle East & North Africa (IDA & IBRD countries)Middle incomeMoldovaMongoliaMontenegroMoroccoMozambiqueMyanmarNamibiaNauruNepalNew CaledoniaNicaraguaNigerNigeriaNorth AmericaNorthern Mariana IslandsOECD membersOmanOther small statesPacific island small statesPakistanPalauPanamaPapua New GuineaParaguayPeruPhilippinesQatarRwandaSamoaSao Tome and PrincipeSaudi ArabiaSenegalSerbiaSeychellesSierra LeoneSingaporeSloveniaSmall statesSolomon IslandsSomaliaSouth AfricaSouth AsiaSouth Asia (IDA & IBRD)South SudanSri LankaSt. Kitts and NevisSt. LuciaSt. Vincent and the GrenadinesSub-Saharan Africa Sub-Saharan Africa (excluding high income)Sub-Saharan Africa (IDA & IBRD countries)SudanSurinameSwazilandSyrian Arab RepublicTajikistanTanzaniaThailandTimor-LesteTogoTongaTrinidad and TobagoTunisiaTurkeyTurkmenistanTurks and Caicos IslandsTuvaluUgandaUkraineUnited Arab EmiratesUpper middle incomeUruguayUzbekistanVanuatuVenezuela, RBVietnamWest Bank and GazaWorldYemen, Rep.ZambiaZimbabwe Linha do tempo:
Nesta escala de tempo está apresentado um gráfico de 1961 ano até 2015 ano Liberia. Dados de 1960 ano ausente. O número de observações reais por data: 55.
Fonte (nome):
Indicadores de desenvolvimento mundial
Fonte (organização):
Development Assistance Committee of the Organisation for Economic Co-operation and Development, Geographical Distribution of Financial Flows to Developing Countries, Development Co-operation Report, and International Development Statistics database. Data are available online at: www.oecd.org/dac/stats/idsonline. World Bank population estimates are used for the denominator.
Categorias:
Aid Effectiveness, Economy & Growth, External Debt
Foi atualizado:
23 abr 2017 ano
Indicadores de alterações dos valores ao longo dos anos
Mínimo:
6.687
1 jan 1974 ano
Máximo:
356.946
1 jan 2011 ano
Na data de observação
Valor
Mudança absoluta
A alteração em relação ao valor anterior
1 jan 1961 ano
8.855
+8.855
0.0%
1 jan 1962 ano
23.469
+14.615
165.05%
1 jan 1963 ano
67.574
+44.105
187.93%
1 jan 1964 ano
28.489
-39.085
-57.84%
1 jan 1965 ano
12.858
-15.631
-54.87%
1 jan 1966 ano
28.181
+15.323
119.16%
1 jan 1967 ano
29.58
+1.399
4.96%
1 jan 1968 ano
19.512
-10.068
-34.04%
1 jan 1969 ano
12.11
-7.401
-37.93%
1 jan 1970 ano
11.834
-0.276
-2.28%
1 jan 1971 ano
9.079
-2.755
-23.28%
1 jan 1972 ano
8.747
-0.333
-3.66%
1 jan 1973 ano
8.622
-0.125
-1.43%
1 jan 1974 ano
6.687
-1.935
-22.45%
1 jan 1975 ano
9.188
+2.501
37.4%
1 jan 1976 ano
12.286
+3.099
33.73%
1 jan 1977 ano
15.787
+3.501
28.5%
1 jan 1978 ano
18.918
+3.13
19.83%
1 jan 1979 ano
26.234
+7.316
38.67%
1 jan 1980 ano
43.9
+17.667
67.34%
1 jan 1981 ano
51.281
+7.38
16.81%
1 jan 1982 ano
55.148
+3.868
7.54%
1 jan 1983 ano
53.189
-1.96
-3.55%
1 jan 1984 ano
55.634
+2.445
4.6%
1 jan 1985 ano
60.314
+4.68
8.41%
1 jan 1986 ano
41.18
-19.135
-31.72%
1 jan 1987 ano
43.881
+2.702
6.56%
1 jan 1988 ano
35.561
-8.32
-18.96%
1 jan 1989 ano
29.589
-5.973
-16.8%
1 jan 1990 ano
28.137
-1.451
-4.9%
1 jan 1991 ano
54.088
+25.95
92.23%
1 jan 1992 ano
76.295
+22.207
41.06%
1 jan 1993 ano
58.955
-17.34
-22.73%
1 jan 1994 ano
60.971
+2.017
3.42%
1 jan 1995 ano
31.399
-29.572
-48.5%
1 jan 1996 ano
59.185
+27.786
88.49%
1 jan 1997 ano
78.565
+19.38
32.74%
1 jan 1998 ano
32.0
-46.565
-59.27%
1 jan 1999 ano
28.142
-3.858
-12.06%
1 jan 2000 ano
34.266
+6.124
21.76%
1 jan 2001 ano
23.313
-10.954
-31.97%
1 jan 2002 ano
12.832
-10.481
-44.96%
1 jan 2003 ano
17.963
+5.132
39.99%
1 jan 2004 ano
34.229
+16.266
90.55%
1 jan 2005 ano
66.962
+32.733
95.63%
1 jan 2006 ano
68.044
+1.082
1.62%
1 jan 2007 ano
76.947
+8.903
13.08%
1 jan 2008 ano
199.126
+122.179
158.78%
1 jan 2009 ano
340.611
+141.485
71.05%
1 jan 2010 ano
134.128
-206.483
-60.62%
1 jan 2011 ano
356.946
+222.818
166.12%
1 jan 2012 ano
186.539
-170.407
-47.74%
1 jan 2013 ano
135.048
-51.492
-27.6%
1 jan 2014 ano
124.62
-10.427
-7.72%
1 jan 2015 ano
169.299
+44.678
35.85%
Classificação de países por estatísticas atuais por anos


Comentários: