29
/pt/
pt
AIzaSyAYiBZKx7MnpbEhh9jyipgxe19OcubqV5w
April 1, 2024
61311
Upper middle income
UMC
false
2
1
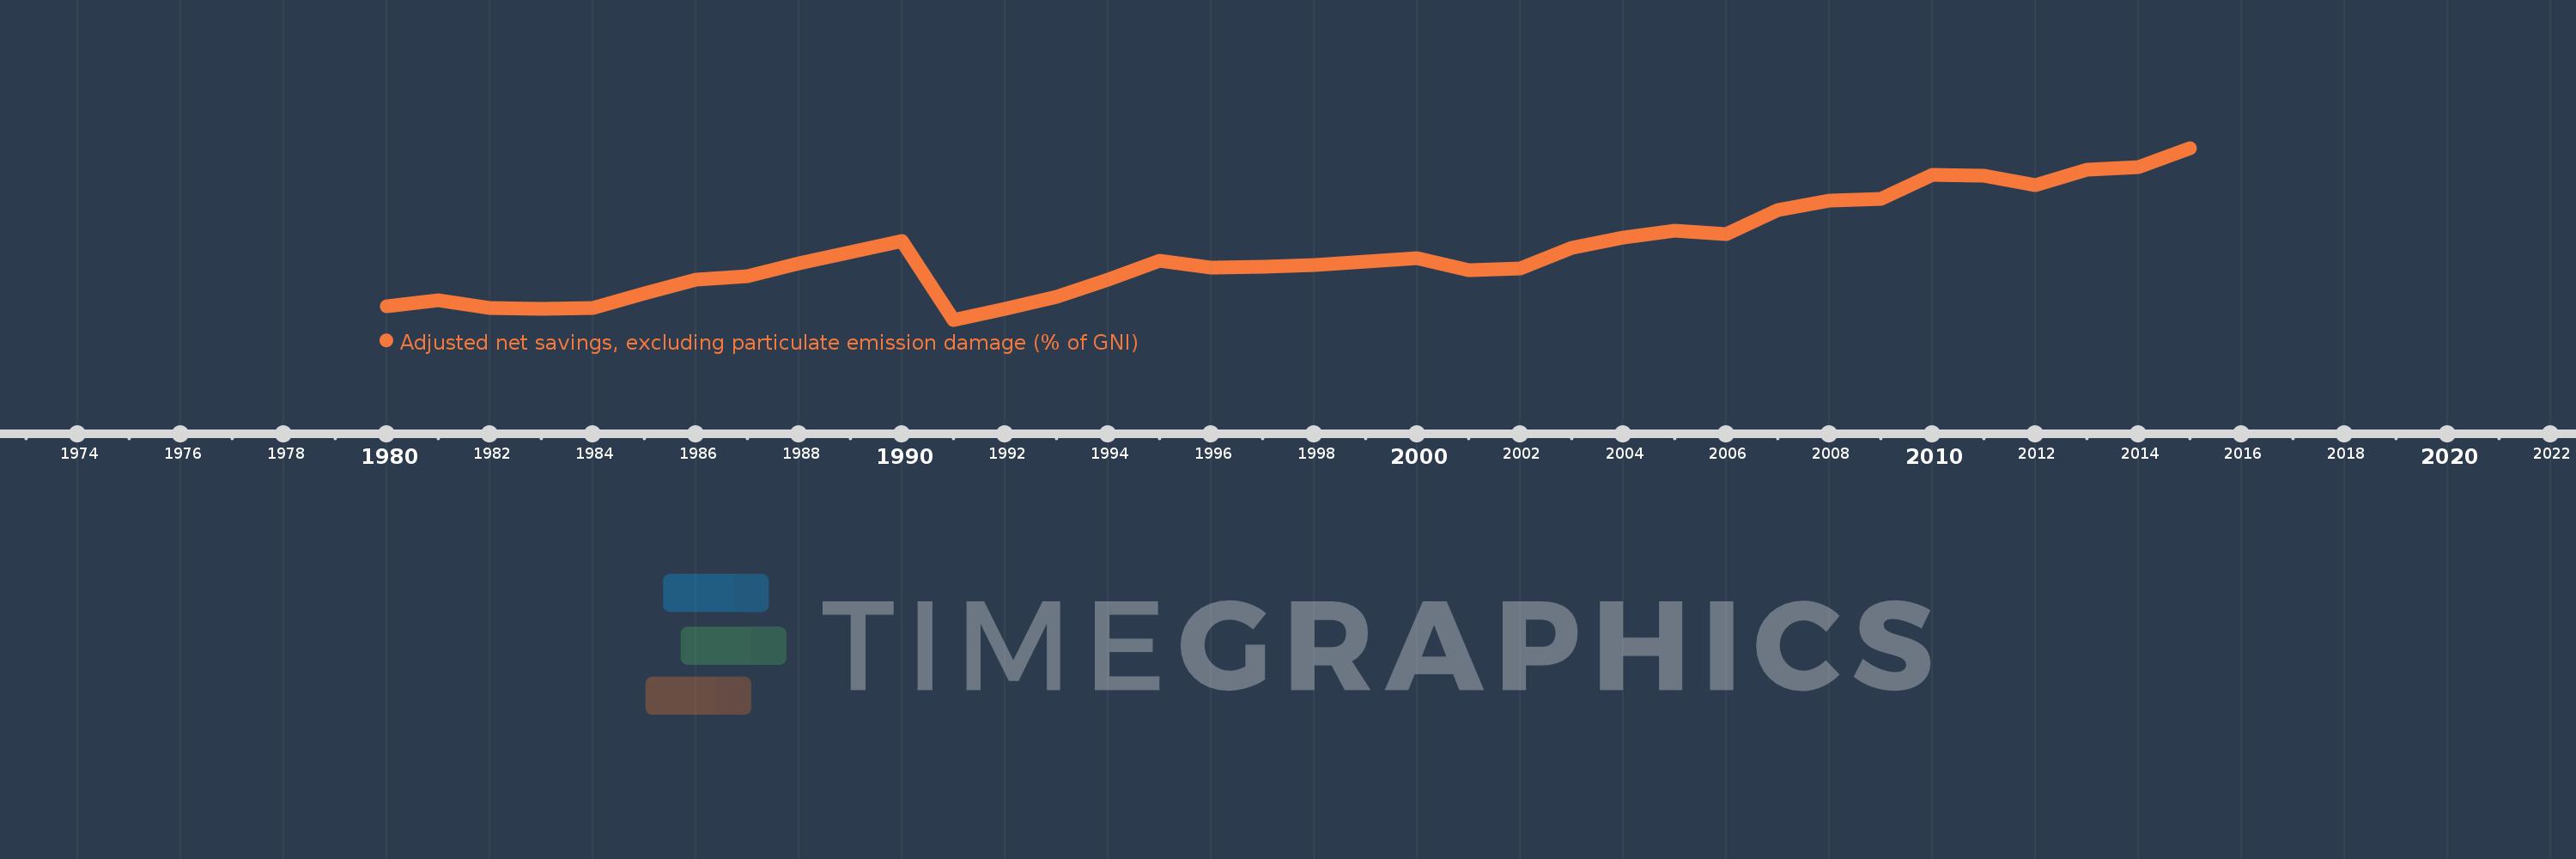
Adjusted net savings, excluding particulate emission damage (% of GNI)
2015,2014,2013,2012,2011,2010,2009,2008,2007,2006,2005,2004,2003,2002,2001,2000,1999,1998,1997,1996,1995,1994,1993,1992,1991,1990,1988,1987,1986,1985,1984,1983,1982,1981,1980
Estas estatísticas em outros países:
AfghanistanAlbaniaAlgeriaAngolaArab WorldArgentinaArmeniaAustraliaAustriaAzerbaijanBahamas, TheBahrainBangladeshBarbadosBelarusBelgiumBelizeBeninBhutanBoliviaBotswanaBrazilBrunei DarussalamBulgariaBurkina FasoBurundiCabo VerdeCambodiaCameroonCanadaCaribbean small statesCentral African RepublicCentral Europe and the BalticsChadChileChinaColombiaComorosCongo, Dem. Rep.Congo, Rep.Costa RicaCote d'IvoireCroatiaCyprusCzech RepublicDenmarkDjiboutiDominicaDominican RepublicEarly-demographic dividendEast Asia & PacificEast Asia & Pacific (excluding high income)East Asia & Pacific (IDA & IBRD countries)EcuadorEgypt, Arab Rep.El SalvadorEquatorial GuineaEritreaEstoniaEthiopiaEuro areaEurope & Central AsiaEurope & Central Asia (excluding high income)Europe & Central Asia (IDA & IBRD countries)European UnionFijiFinlandFragile and conflict affected situationsFranceGabonGambia, TheGeorgiaGermanyGhanaGreeceGuatemalaGuineaGuinea-BissauGuyanaHaitiHeavily indebted poor countries (HIPC)High incomeHondurasHungaryIBRD onlyIcelandIDA & IBRD totalIDA blendIDA onlyIDA totalIndiaIndonesiaIran, Islamic Rep.IraqIrelandIsraelItalyJamaicaJapanJordanKazakhstanKenyaKiribatiKorea, Rep.KuwaitKyrgyz RepublicLao PDRLate-demographic dividendLatin America & Caribbean Latin America & Caribbean (excluding high income)Latin America & the Caribbean (IDA & IBRD countries)LatviaLeast developed countries: UN classificationLebanonLesothoLiberiaLibyaLithuaniaLow & middle incomeLow incomeLower middle incomeLuxembourgMacedonia, FYRMadagascarMalawiMalaysiaMaldivesMaliMauritaniaMauritiusMexicoMiddle East & North AfricaMiddle East & North Africa (excluding high income)Middle East & North Africa (IDA & IBRD countries)Middle incomeMoldovaMongoliaMoroccoMozambiqueNamibiaNepalNetherlandsNew ZealandNicaraguaNigerNigeriaNorth AmericaNorwayOECD membersOmanOther small statesPacific island small statesPakistanPanamaPapua New GuineaParaguayPeruPhilippinesPolandPortugalPost-demographic dividendPre-demographic dividendQatarRomaniaRussian FederationRwandaSaudi ArabiaSenegalSeychellesSierra LeoneSingaporeSlovak RepublicSloveniaSmall statesSolomon IslandsSouth AfricaSouth AsiaSouth Asia (IDA & IBRD)SpainSri LankaSt. LuciaSt. Vincent and the GrenadinesSub-Saharan Africa Sub-Saharan Africa (excluding high income)Sub-Saharan Africa (IDA & IBRD countries)SudanSurinameSwazilandSwedenSwitzerlandSyrian Arab RepublicTajikistanTanzaniaThailandTogoTongaTrinidad and TobagoTunisiaTurkeyUgandaUkraineUnited KingdomUnited StatesUpper middle incomeUruguayVanuatuVenezuela, RBVietnamWorldYemen, Rep.ZambiaZimbabwe Linha do tempo:
Nesta escala de tempo está apresentado um gráfico de 1980 ano até 2015 ano Upper middle income. Dados de 1979 ano ausente. O número de observações reais por data: 35.
Fonte (nome):
Indicadores de desenvolvimento mundial
Fonte (organização):
World Bank staff estimates based on sources and methods in World Bank's "The Changing Wealth of Nations: Measuring Sustainable Development in the New Millennium" (2011).
Categorias:
Economy & Growth, Environment
Foi atualizado:
23 abr 2017 ano
Indicadores de alterações dos valores ao longo dos anos
Mínimo:
7.393
1 jan 1991 ano
Máximo:
22.614
1 jan 2015 ano
Na data de observação
Valor
Mudança absoluta
A alteração em relação ao valor anterior
1 jan 1980 ano
8.588
+8.588
0.0%
1 jan 1981 ano
9.145
+0.557
6.48%
1 jan 1982 ano
8.443
-0.702
-7.68%
1 jan 1983 ano
8.337
-0.106
-1.26%
1 jan 1984 ano
8.412
+0.076
0.91%
1 jan 1985 ano
9.706
+1.294
15.38%
1 jan 1986 ano
10.92
+1.214
12.5%
1 jan 1987 ano
11.23
+0.311
2.84%
1 jan 1988 ano
12.358
+1.127
10.04%
1 jan 1990 ano
14.368
+2.011
16.27%
1 jan 1991 ano
7.393
-6.975
-48.54%
1 jan 1992 ano
8.367
+0.974
13.17%
1 jan 1993 ano
9.41
+1.043
12.46%
1 jan 1994 ano
10.91
+1.501
15.95%
1 jan 1995 ano
12.59
+1.68
15.4%
1 jan 1996 ano
12.039
-0.551
-4.38%
1 jan 1997 ano
12.06
+0.021
0.18%
1 jan 1998 ano
12.216
+0.156
1.29%
1 jan 1999 ano
12.56
+0.344
2.81%
1 jan 2000 ano
12.859
+0.299
2.38%
1 jan 2001 ano
11.784
-1.076
-8.36%
1 jan 2002 ano
11.927
+0.143
1.21%
1 jan 2003 ano
13.725
+1.799
15.08%
1 jan 2004 ano
14.686
+0.961
7.0%
1 jan 2005 ano
15.302
+0.616
4.19%
1 jan 2006 ano
14.976
-0.326
-2.13%
1 jan 2007 ano
17.084
+2.108
14.07%
1 jan 2008 ano
17.941
+0.858
5.02%
1 jan 2009 ano
18.103
+0.161
0.9%
1 jan 2010 ano
20.207
+2.104
11.62%
1 jan 2011 ano
20.172
-0.035
-0.17%
1 jan 2012 ano
19.321
-0.85
-4.22%
1 jan 2013 ano
20.654
+1.333
6.9%
1 jan 2014 ano
20.911
+0.257
1.24%
1 jan 2015 ano
22.614
+1.703
8.14%
Classificação de países por estatísticas atuais por anos


Comentários: