29
/pt/
pt
AIzaSyAYiBZKx7MnpbEhh9jyipgxe19OcubqV5w
April 1, 2024
279461
Vanuatu
VUT
true
2
1
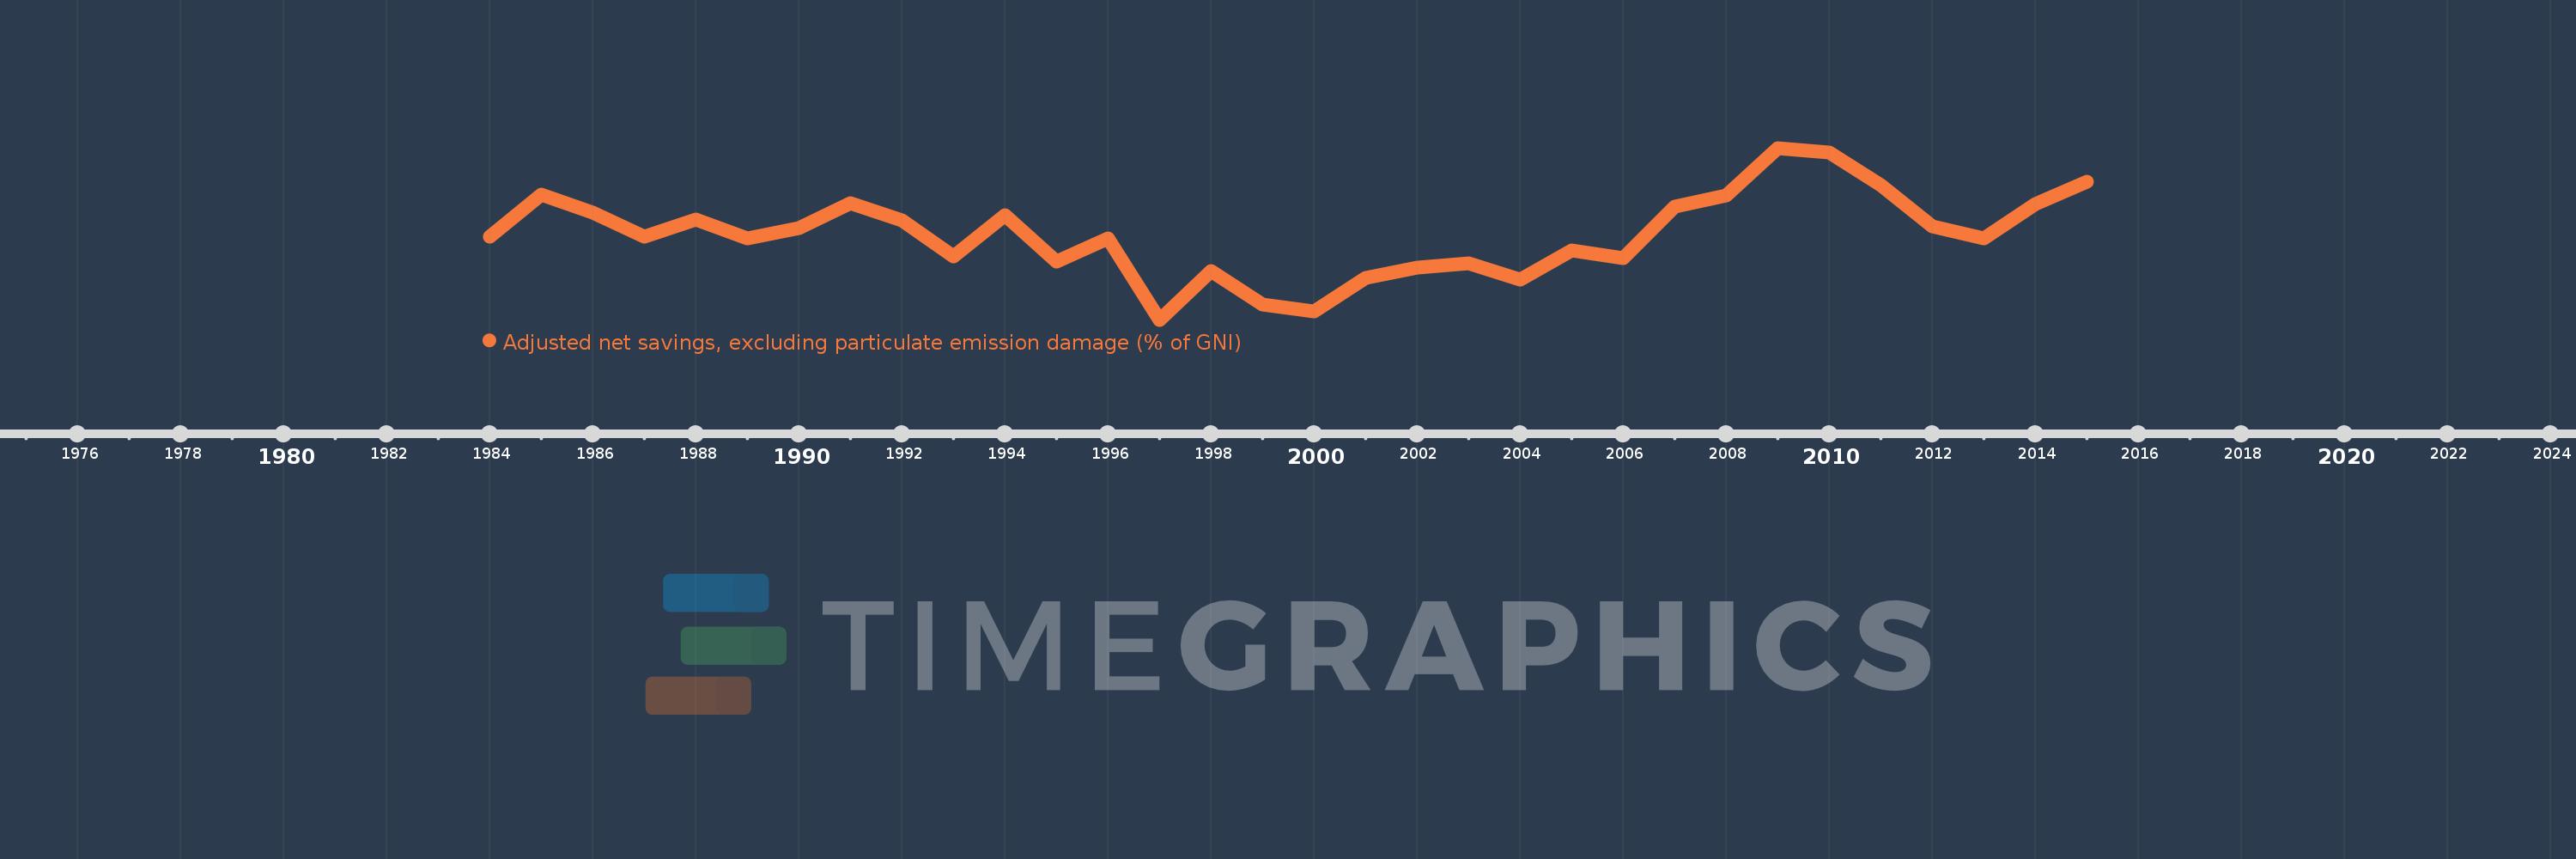
Adjusted net savings, excluding particulate emission damage (% of GNI)
2015,2014,2013,2012,2011,2010,2009,2008,2007,2006,2005,2004,2003,2002,2001,2000,1999,1998,1997,1996,1995,1994,1993,1992,1991,1990,1989,1988,1987,1986,1985,1984
Estas estatísticas em outros países:
AfghanistanAlbaniaAlgeriaAngolaArab WorldArgentinaArmeniaAustraliaAustriaAzerbaijanBahamas, TheBahrainBangladeshBarbadosBelarusBelgiumBelizeBeninBhutanBoliviaBotswanaBrazilBrunei DarussalamBulgariaBurkina FasoBurundiCabo VerdeCambodiaCameroonCanadaCaribbean small statesCentral African RepublicCentral Europe and the BalticsChadChileChinaColombiaComorosCongo, Dem. Rep.Congo, Rep.Costa RicaCote d'IvoireCroatiaCyprusCzech RepublicDenmarkDjiboutiDominicaDominican RepublicEarly-demographic dividendEast Asia & PacificEast Asia & Pacific (excluding high income)East Asia & Pacific (IDA & IBRD countries)EcuadorEgypt, Arab Rep.El SalvadorEquatorial GuineaEritreaEstoniaEthiopiaEuro areaEurope & Central AsiaEurope & Central Asia (excluding high income)Europe & Central Asia (IDA & IBRD countries)European UnionFijiFinlandFragile and conflict affected situationsFranceGabonGambia, TheGeorgiaGermanyGhanaGreeceGuatemalaGuineaGuinea-BissauGuyanaHaitiHeavily indebted poor countries (HIPC)High incomeHondurasHungaryIBRD onlyIcelandIDA & IBRD totalIDA blendIDA onlyIDA totalIndiaIndonesiaIran, Islamic Rep.IraqIrelandIsraelItalyJamaicaJapanJordanKazakhstanKenyaKiribatiKorea, Rep.KuwaitKyrgyz RepublicLao PDRLate-demographic dividendLatin America & Caribbean Latin America & Caribbean (excluding high income)Latin America & the Caribbean (IDA & IBRD countries)LatviaLeast developed countries: UN classificationLebanonLesothoLiberiaLibyaLithuaniaLow & middle incomeLow incomeLower middle incomeLuxembourgMacedonia, FYRMadagascarMalawiMalaysiaMaldivesMaliMauritaniaMauritiusMexicoMiddle East & North AfricaMiddle East & North Africa (excluding high income)Middle East & North Africa (IDA & IBRD countries)Middle incomeMoldovaMongoliaMoroccoMozambiqueNamibiaNepalNetherlandsNew ZealandNicaraguaNigerNigeriaNorth AmericaNorwayOECD membersOmanOther small statesPacific island small statesPakistanPanamaPapua New GuineaParaguayPeruPhilippinesPolandPortugalPost-demographic dividendPre-demographic dividendQatarRomaniaRussian FederationRwandaSaudi ArabiaSenegalSeychellesSierra LeoneSingaporeSlovak RepublicSloveniaSmall statesSolomon IslandsSouth AfricaSouth AsiaSouth Asia (IDA & IBRD)SpainSri LankaSt. LuciaSt. Vincent and the GrenadinesSub-Saharan Africa Sub-Saharan Africa (excluding high income)Sub-Saharan Africa (IDA & IBRD countries)SudanSurinameSwazilandSwedenSwitzerlandSyrian Arab RepublicTajikistanTanzaniaThailandTogoTongaTrinidad and TobagoTunisiaTurkeyUgandaUkraineUnited KingdomUnited StatesUpper middle incomeUruguayVanuatuVenezuela, RBVietnamWorldYemen, Rep.ZambiaZimbabwe Linha do tempo:
Nesta escala de tempo está apresentado um gráfico de 1984 ano até 2015 ano Vanuatu. Dados de 1983 ano ausente. O número de observações reais por data: 32.
Fonte (nome):
Indicadores de desenvolvimento mundial
Fonte (organização):
World Bank staff estimates based on sources and methods in World Bank's "The Changing Wealth of Nations: Measuring Sustainable Development in the New Millennium" (2011).
Categorias:
Economy & Growth, Environment
Foi atualizado:
23 abr 2017 ano
Indicadores de alterações dos valores ao longo dos anos
Mínimo:
-1.372
1 jan 1997 ano
Máximo:
31.293
1 jan 2009 ano
Na data de observação
Valor
Mudança absoluta
A alteração em relação ao valor anterior
1 jan 1984 ano
14.368
+14.368
0.0%
1 jan 1985 ano
22.473
+8.105
56.41%
1 jan 1986 ano
18.995
-3.477
-15.47%
1 jan 1987 ano
14.5
-4.495
-23.67%
1 jan 1988 ano
17.742
+3.243
22.36%
1 jan 1989 ano
14.049
-3.694
-20.82%
1 jan 1990 ano
16.017
+1.968
14.01%
1 jan 1991 ano
20.771
+4.754
29.68%
1 jan 1992 ano
17.573
-3.198
-15.4%
1 jan 1993 ano
10.622
-6.951
-39.55%
1 jan 1994 ano
18.582
+7.961
74.94%
1 jan 1995 ano
9.735
-8.848
-47.61%
1 jan 1996 ano
14.071
+4.336
44.54%
1 jan 1997 ano
-1.372
-15.443
-109.75%
1 jan 1998 ano
7.869
+9.241
-673.52%
1 jan 1999 ano
1.508
-6.36
-80.83%
1 jan 2000 ano
0.18
-1.328
-88.07%
1 jan 2001 ano
6.547
+6.367
3.54 mil%
1 jan 2002 ano
8.61
+2.063
31.52%
1 jan 2003 ano
9.29
+0.68
7.9%
1 jan 2004 ano
6.19
-3.1
-33.37%
1 jan 2005 ano
11.757
+5.567
89.92%
1 jan 2006 ano
10.318
-1.439
-12.24%
1 jan 2007 ano
20.198
+9.88
95.76%
1 jan 2008 ano
22.265
+2.067
10.23%
1 jan 2009 ano
31.293
+9.028
40.55%
1 jan 2010 ano
30.349
-0.944
-3.02%
1 jan 2011 ano
24.236
-6.113
-20.14%
1 jan 2012 ano
16.427
-7.809
-32.22%
1 jan 2013 ano
14.102
-2.325
-14.15%
1 jan 2014 ano
20.639
+6.536
46.35%
1 jan 2015 ano
24.859
+4.22
20.45%
Classificação de países por estatísticas atuais por anos


Comentários: