29
/pt/
pt
AIzaSyAYiBZKx7MnpbEhh9jyipgxe19OcubqV5w
April 1, 2024
124399
Egypt, Arab Rep.
EGY
true
2
1
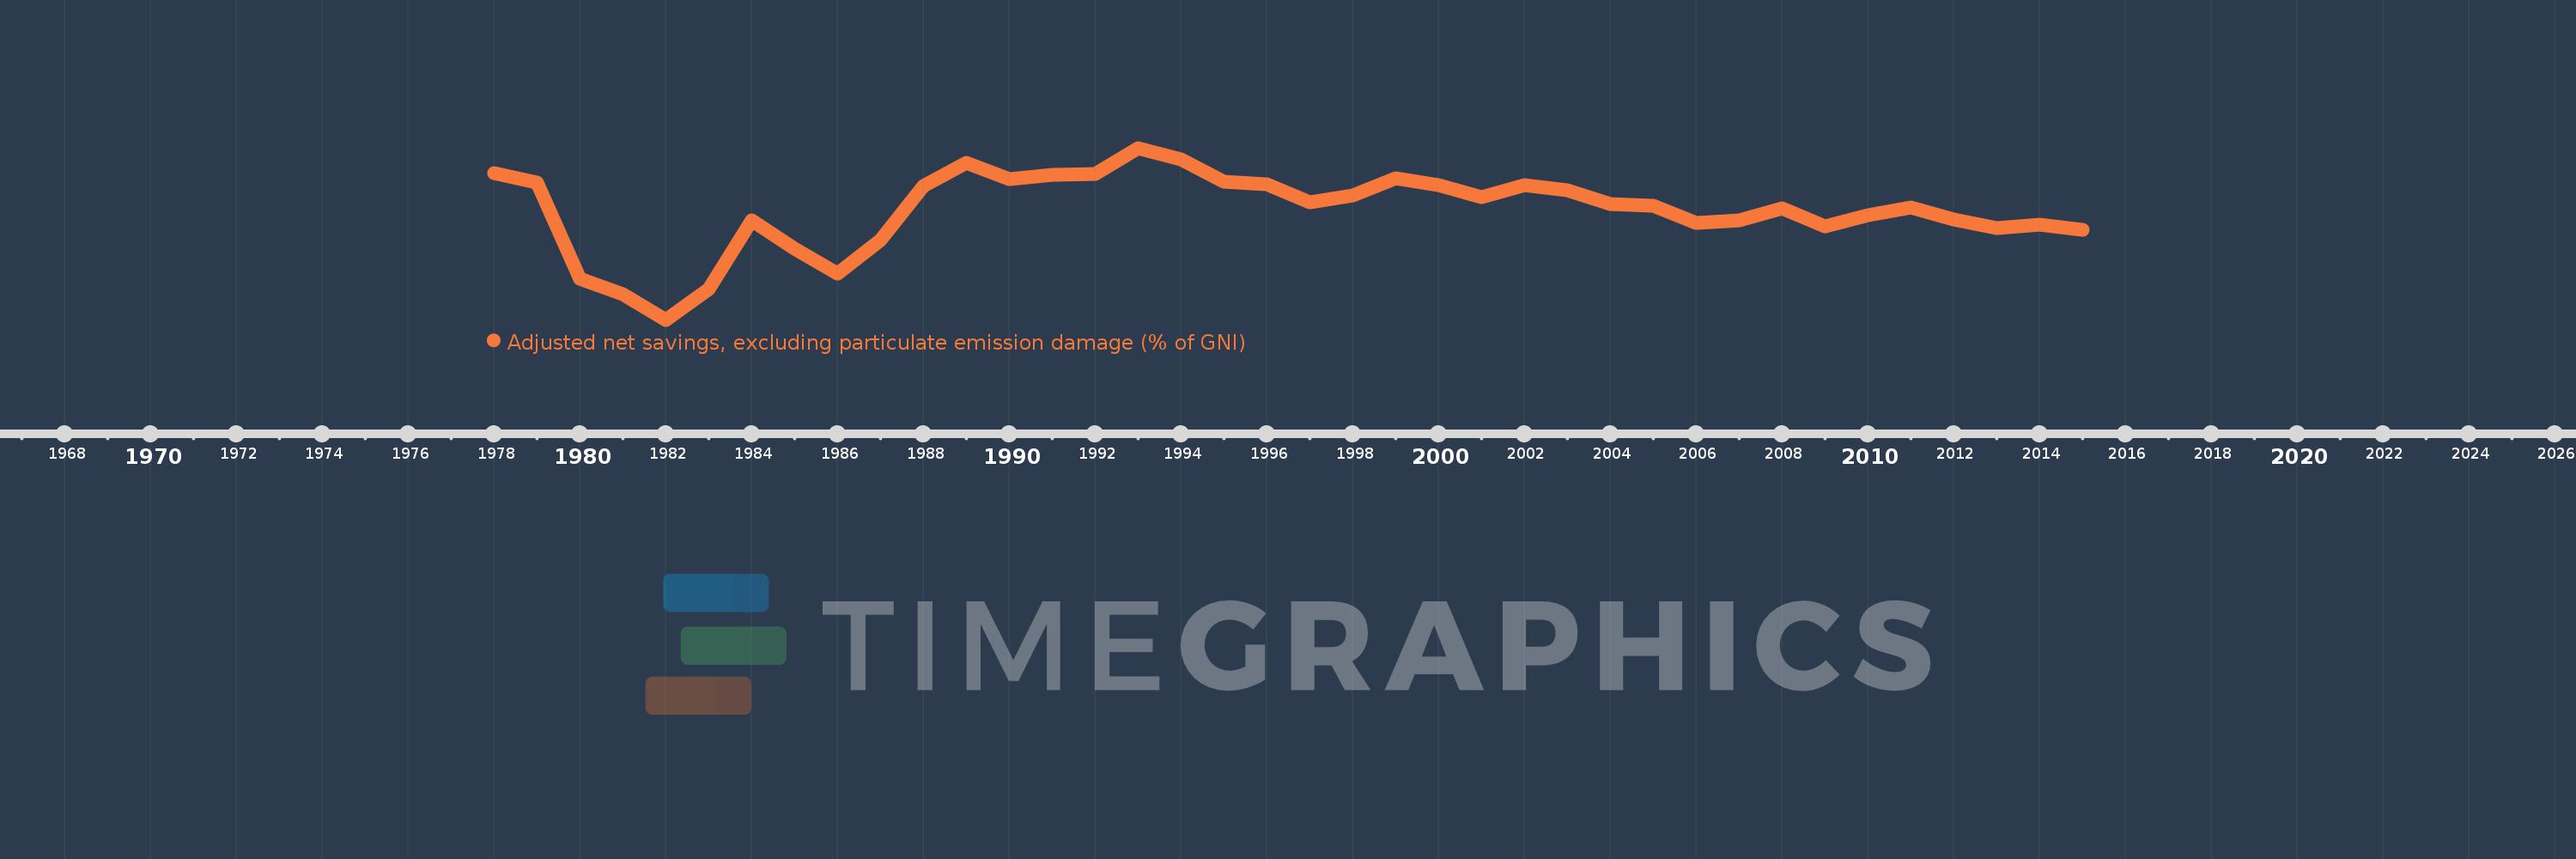
Adjusted net savings, excluding particulate emission damage (% of GNI)
2015,2014,2013,2012,2011,2010,2009,2008,2007,2006,2005,2004,2003,2002,2001,2000,1999,1998,1997,1996,1995,1994,1993,1992,1991,1990,1989,1988,1987,1986,1985,1984,1983,1982,1981,1980,1979,1978
Estas estatísticas em outros países:
AfghanistanAlbaniaAlgeriaAngolaArab WorldArgentinaArmeniaAustraliaAustriaAzerbaijanBahamas, TheBahrainBangladeshBarbadosBelarusBelgiumBelizeBeninBhutanBoliviaBotswanaBrazilBrunei DarussalamBulgariaBurkina FasoBurundiCabo VerdeCambodiaCameroonCanadaCaribbean small statesCentral African RepublicCentral Europe and the BalticsChadChileChinaColombiaComorosCongo, Dem. Rep.Congo, Rep.Costa RicaCote d'IvoireCroatiaCyprusCzech RepublicDenmarkDjiboutiDominicaDominican RepublicEarly-demographic dividendEast Asia & PacificEast Asia & Pacific (excluding high income)East Asia & Pacific (IDA & IBRD countries)EcuadorEgypt, Arab Rep.El SalvadorEquatorial GuineaEritreaEstoniaEthiopiaEuro areaEurope & Central AsiaEurope & Central Asia (excluding high income)Europe & Central Asia (IDA & IBRD countries)European UnionFijiFinlandFragile and conflict affected situationsFranceGabonGambia, TheGeorgiaGermanyGhanaGreeceGuatemalaGuineaGuinea-BissauGuyanaHaitiHeavily indebted poor countries (HIPC)High incomeHondurasHungaryIBRD onlyIcelandIDA & IBRD totalIDA blendIDA onlyIDA totalIndiaIndonesiaIran, Islamic Rep.IraqIrelandIsraelItalyJamaicaJapanJordanKazakhstanKenyaKiribatiKorea, Rep.KuwaitKyrgyz RepublicLao PDRLate-demographic dividendLatin America & Caribbean Latin America & Caribbean (excluding high income)Latin America & the Caribbean (IDA & IBRD countries)LatviaLeast developed countries: UN classificationLebanonLesothoLiberiaLibyaLithuaniaLow & middle incomeLow incomeLower middle incomeLuxembourgMacedonia, FYRMadagascarMalawiMalaysiaMaldivesMaliMauritaniaMauritiusMexicoMiddle East & North AfricaMiddle East & North Africa (excluding high income)Middle East & North Africa (IDA & IBRD countries)Middle incomeMoldovaMongoliaMoroccoMozambiqueNamibiaNepalNetherlandsNew ZealandNicaraguaNigerNigeriaNorth AmericaNorwayOECD membersOmanOther small statesPacific island small statesPakistanPanamaPapua New GuineaParaguayPeruPhilippinesPolandPortugalPost-demographic dividendPre-demographic dividendQatarRomaniaRussian FederationRwandaSaudi ArabiaSenegalSeychellesSierra LeoneSingaporeSlovak RepublicSloveniaSmall statesSolomon IslandsSouth AfricaSouth AsiaSouth Asia (IDA & IBRD)SpainSri LankaSt. LuciaSt. Vincent and the GrenadinesSub-Saharan Africa Sub-Saharan Africa (excluding high income)Sub-Saharan Africa (IDA & IBRD countries)SudanSurinameSwazilandSwedenSwitzerlandSyrian Arab RepublicTajikistanTanzaniaThailandTogoTongaTrinidad and TobagoTunisiaTurkeyUgandaUkraineUnited KingdomUnited StatesUpper middle incomeUruguayVanuatuVenezuela, RBVietnamWorldYemen, Rep.ZambiaZimbabwe Linha do tempo:
Nesta escala de tempo está apresentado um gráfico de 1978 ano até 2015 ano Egypt, Arab Rep.. Dados de 1977 ano ausente. O número de observações reais por data: 38.
Fonte (nome):
Indicadores de desenvolvimento mundial
Fonte (organização):
World Bank staff estimates based on sources and methods in World Bank's "The Changing Wealth of Nations: Measuring Sustainable Development in the New Millennium" (2011).
Categorias:
Economy & Growth, Environment
Foi atualizado:
23 abr 2017 ano
Indicadores de alterações dos valores ao longo dos anos
Mínimo:
-14.854
1 jan 1982 ano
Máximo:
18.861
1 jan 1993 ano
Na data de observação
Valor
Mudança absoluta
A alteração em relação ao valor anterior
1 jan 1978 ano
13.976
+13.976
0.0%
1 jan 1979 ano
12.11
-1.866
-13.35%
1 jan 1980 ano
-6.731
-18.841
-155.58%
1 jan 1981 ano
-9.833
-3.102
46.08%
1 jan 1982 ano
-14.854
-5.021
51.06%
1 jan 1983 ano
-8.801
+6.053
-40.75%
1 jan 1984 ano
4.694
+13.495
-153.34%
1 jan 1985 ano
-0.913
-5.607
-119.45%
1 jan 1986 ano
-5.728
-4.815
527.45%
1 jan 1987 ano
0.692
+6.42
-112.09%
1 jan 1988 ano
11.439
+10.746
1.55 mil%
1 jan 1989 ano
15.897
+4.458
38.98%
1 jan 1990 ano
12.724
-3.173
-19.96%
1 jan 1991 ano
13.573
+0.849
6.67%
1 jan 1992 ano
13.682
+0.109
0.8%
1 jan 1993 ano
18.861
+5.18
37.86%
1 jan 1994 ano
16.681
-2.18
-11.56%
1 jan 1995 ano
12.317
-4.364
-26.16%
1 jan 1996 ano
11.661
-0.656
-5.32%
1 jan 1997 ano
8.213
-3.448
-29.57%
1 jan 1998 ano
9.518
+1.305
15.9%
1 jan 1999 ano
12.973
+3.454
36.29%
1 jan 2000 ano
11.567
-1.405
-10.83%
1 jan 2001 ano
9.123
-2.444
-21.13%
1 jan 2002 ano
11.554
+2.431
26.65%
1 jan 2003 ano
10.501
-1.053
-9.11%
1 jan 2004 ano
7.858
-2.643
-25.17%
1 jan 2005 ano
7.535
-0.323
-4.11%
1 jan 2006 ano
4.139
-3.395
-45.06%
1 jan 2007 ano
4.728
+0.589
14.23%
1 jan 2008 ano
6.934
+2.206
46.65%
1 jan 2009 ano
3.508
-3.426
-49.41%
1 jan 2010 ano
5.628
+2.12
60.43%
1 jan 2011 ano
7.129
+1.501
26.67%
1 jan 2012 ano
4.89
-2.239
-31.41%
1 jan 2013 ano
3.055
-1.835
-37.53%
1 jan 2014 ano
3.757
+0.702
22.98%
1 jan 2015 ano
2.778
-0.979
-26.06%
Classificação de países por estatísticas atuais por anos


Comentários: