29
/pt/
pt
AIzaSyAYiBZKx7MnpbEhh9jyipgxe19OcubqV5w
April 1, 2024
195119
Mexico
MEX
true
2
1
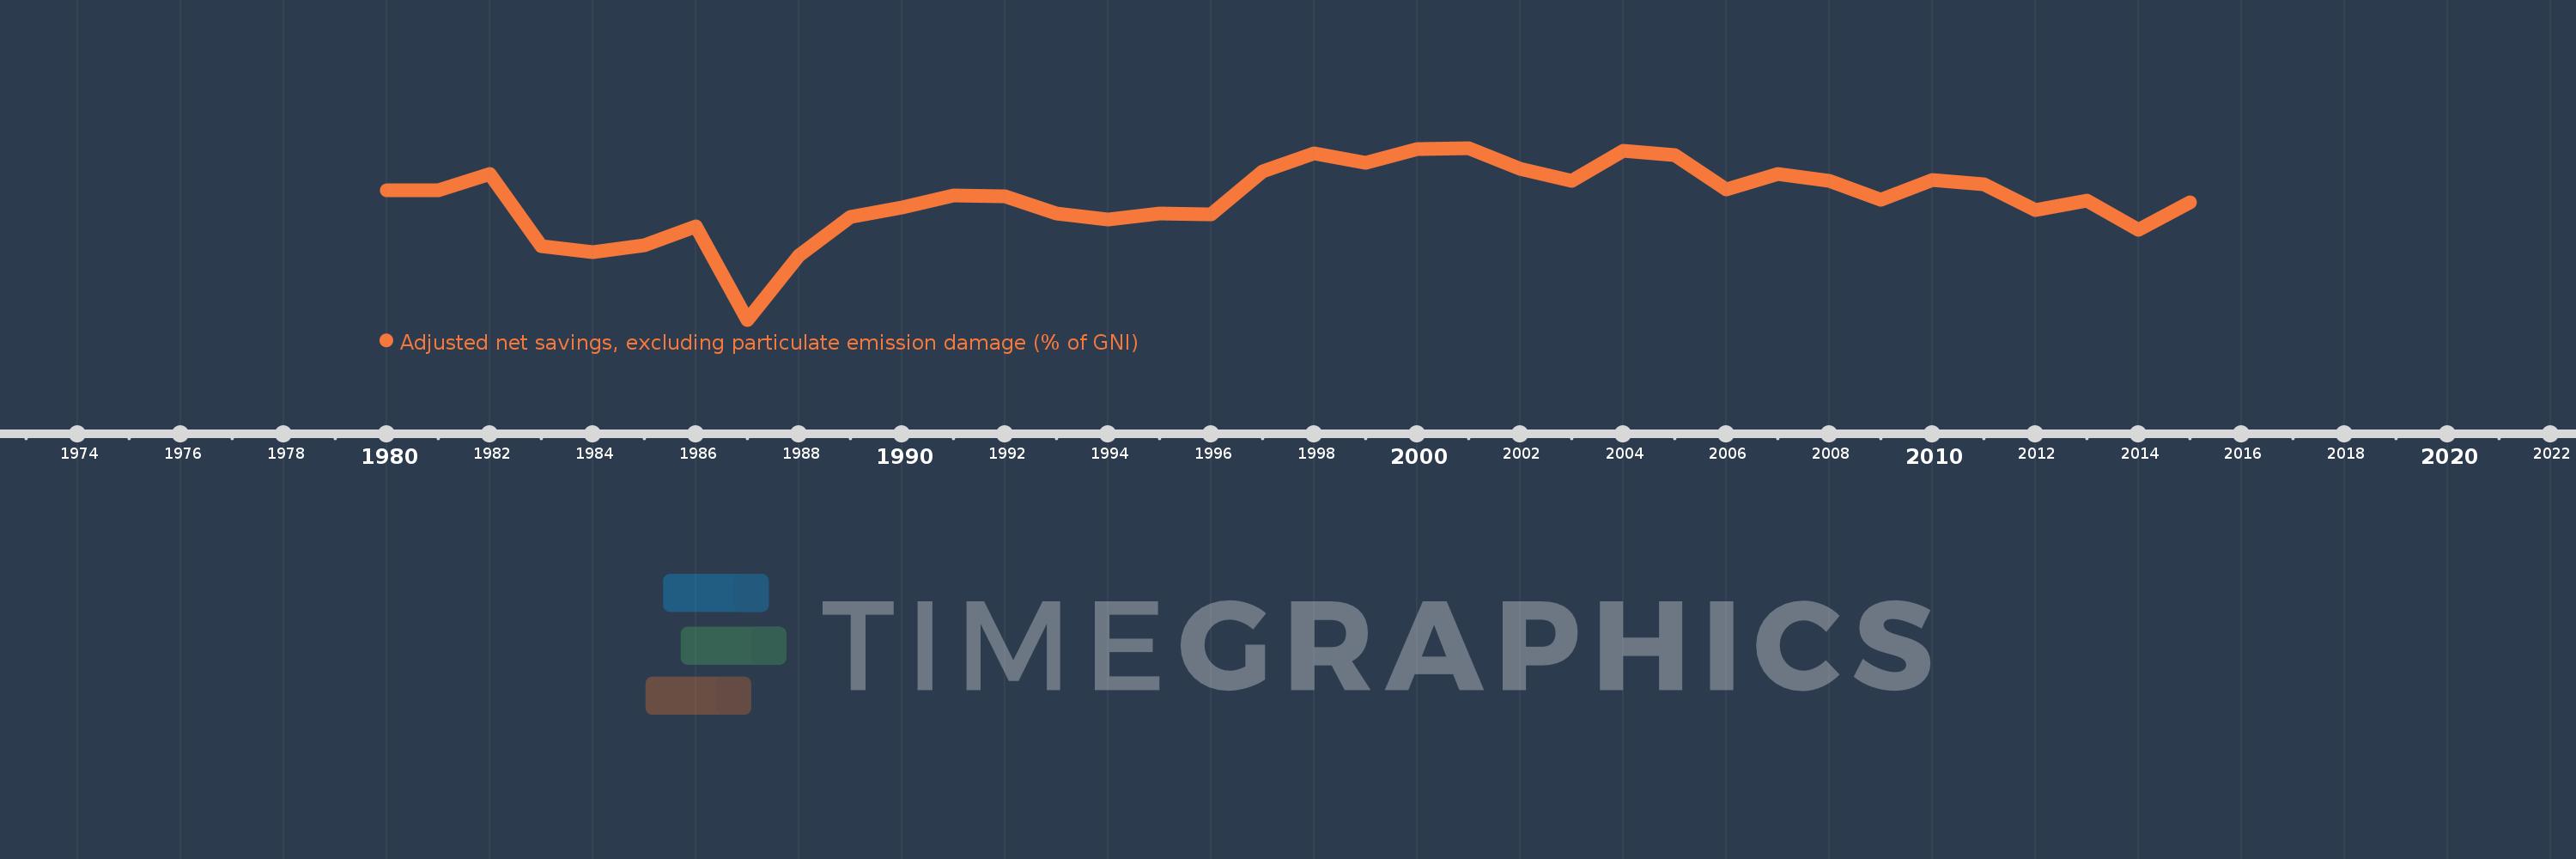
Adjusted net savings, excluding particulate emission damage (% of GNI)
2015,2014,2013,2012,2011,2010,2009,2008,2007,2006,2005,2004,2003,2002,2001,2000,1999,1998,1997,1996,1995,1994,1993,1992,1991,1990,1989,1988,1987,1986,1985,1984,1983,1982,1981,1980
Estas estatísticas em outros países:
AfghanistanAlbaniaAlgeriaAngolaArab WorldArgentinaArmeniaAustraliaAustriaAzerbaijanBahamas, TheBahrainBangladeshBarbadosBelarusBelgiumBelizeBeninBhutanBoliviaBotswanaBrazilBrunei DarussalamBulgariaBurkina FasoBurundiCabo VerdeCambodiaCameroonCanadaCaribbean small statesCentral African RepublicCentral Europe and the BalticsChadChileChinaColombiaComorosCongo, Dem. Rep.Congo, Rep.Costa RicaCote d'IvoireCroatiaCyprusCzech RepublicDenmarkDjiboutiDominicaDominican RepublicEarly-demographic dividendEast Asia & PacificEast Asia & Pacific (excluding high income)East Asia & Pacific (IDA & IBRD countries)EcuadorEgypt, Arab Rep.El SalvadorEquatorial GuineaEritreaEstoniaEthiopiaEuro areaEurope & Central AsiaEurope & Central Asia (excluding high income)Europe & Central Asia (IDA & IBRD countries)European UnionFijiFinlandFragile and conflict affected situationsFranceGabonGambia, TheGeorgiaGermanyGhanaGreeceGuatemalaGuineaGuinea-BissauGuyanaHaitiHeavily indebted poor countries (HIPC)High incomeHondurasHungaryIBRD onlyIcelandIDA & IBRD totalIDA blendIDA onlyIDA totalIndiaIndonesiaIran, Islamic Rep.IraqIrelandIsraelItalyJamaicaJapanJordanKazakhstanKenyaKiribatiKorea, Rep.KuwaitKyrgyz RepublicLao PDRLate-demographic dividendLatin America & Caribbean Latin America & Caribbean (excluding high income)Latin America & the Caribbean (IDA & IBRD countries)LatviaLeast developed countries: UN classificationLebanonLesothoLiberiaLibyaLithuaniaLow & middle incomeLow incomeLower middle incomeLuxembourgMacedonia, FYRMadagascarMalawiMalaysiaMaldivesMaliMauritaniaMauritiusMexicoMiddle East & North AfricaMiddle East & North Africa (excluding high income)Middle East & North Africa (IDA & IBRD countries)Middle incomeMoldovaMongoliaMoroccoMozambiqueNamibiaNepalNetherlandsNew ZealandNicaraguaNigerNigeriaNorth AmericaNorwayOECD membersOmanOther small statesPacific island small statesPakistanPanamaPapua New GuineaParaguayPeruPhilippinesPolandPortugalPost-demographic dividendPre-demographic dividendQatarRomaniaRussian FederationRwandaSaudi ArabiaSenegalSeychellesSierra LeoneSingaporeSlovak RepublicSloveniaSmall statesSolomon IslandsSouth AfricaSouth AsiaSouth Asia (IDA & IBRD)SpainSri LankaSt. LuciaSt. Vincent and the GrenadinesSub-Saharan Africa Sub-Saharan Africa (excluding high income)Sub-Saharan Africa (IDA & IBRD countries)SudanSurinameSwazilandSwedenSwitzerlandSyrian Arab RepublicTajikistanTanzaniaThailandTogoTongaTrinidad and TobagoTunisiaTurkeyUgandaUkraineUnited KingdomUnited StatesUpper middle incomeUruguayVanuatuVenezuela, RBVietnamWorldYemen, Rep.ZambiaZimbabwe Linha do tempo:
Nesta escala de tempo está apresentado um gráfico de 1980 ano até 2015 ano Mexico. Dados de 1979 ano ausente. O número de observações reais por data: 36.
Fonte (nome):
Indicadores de desenvolvimento mundial
Fonte (organização):
World Bank staff estimates based on sources and methods in World Bank's "The Changing Wealth of Nations: Measuring Sustainable Development in the New Millennium" (2011).
Categorias:
Economy & Growth, Environment
Foi atualizado:
23 abr 2017 ano
Indicadores de alterações dos valores ao longo dos anos
Mínimo:
1.283
1 jan 1987 ano
Máximo:
11.091
1 jan 2001 ano
Na data de observação
Valor
Mudança absoluta
A alteração em relação ao valor anterior
1 jan 1980 ano
8.656
+8.656
0.0%
1 jan 1981 ano
8.683
+0.027
0.31%
1 jan 1982 ano
9.585
+0.902
10.39%
1 jan 1983 ano
5.477
-4.108
-42.86%
1 jan 1984 ano
5.165
-0.312
-5.69%
1 jan 1985 ano
5.551
+0.386
7.47%
1 jan 1986 ano
6.6
+1.049
18.9%
1 jan 1987 ano
1.283
-5.317
-80.56%
1 jan 1988 ano
4.955
+3.672
286.11%
1 jan 1989 ano
7.174
+2.219
44.77%
1 jan 1990 ano
7.685
+0.511
7.13%
1 jan 1991 ano
8.393
+0.708
9.21%
1 jan 1992 ano
8.328
-0.065
-0.78%
1 jan 1993 ano
7.345
-0.982
-11.79%
1 jan 1994 ano
7.004
-0.342
-4.65%
1 jan 1995 ano
7.365
+0.361
5.16%
1 jan 1996 ano
7.288
-0.077
-1.05%
1 jan 1997 ano
9.767
+2.479
34.01%
1 jan 1998 ano
10.786
+1.019
10.44%
1 jan 1999 ano
10.243
-0.543
-5.03%
1 jan 2000 ano
11.027
+0.784
7.65%
1 jan 2001 ano
11.091
+0.064
0.58%
1 jan 2002 ano
9.887
-1.204
-10.85%
1 jan 2003 ano
9.209
-0.678
-6.86%
1 jan 2004 ano
10.952
+1.743
18.93%
1 jan 2005 ano
10.708
-0.244
-2.23%
1 jan 2006 ano
8.74
-1.968
-18.38%
1 jan 2007 ano
9.614
+0.874
9.99%
1 jan 2008 ano
9.227
-0.387
-4.03%
1 jan 2009 ano
8.125
-1.102
-11.94%
1 jan 2010 ano
9.279
+1.155
14.21%
1 jan 2011 ano
9.014
-0.265
-2.86%
1 jan 2012 ano
7.532
-1.482
-16.45%
1 jan 2013 ano
8.066
+0.534
7.09%
1 jan 2014 ano
6.427
-1.638
-20.31%
1 jan 2015 ano
7.979
+1.552
24.15%
Classificação de países por estatísticas atuais por anos


Comentários: