29
/pt/
pt
AIzaSyAYiBZKx7MnpbEhh9jyipgxe19OcubqV5w
April 1, 2024
44018
Least developed countries: UN classification
LDC
false
2
1
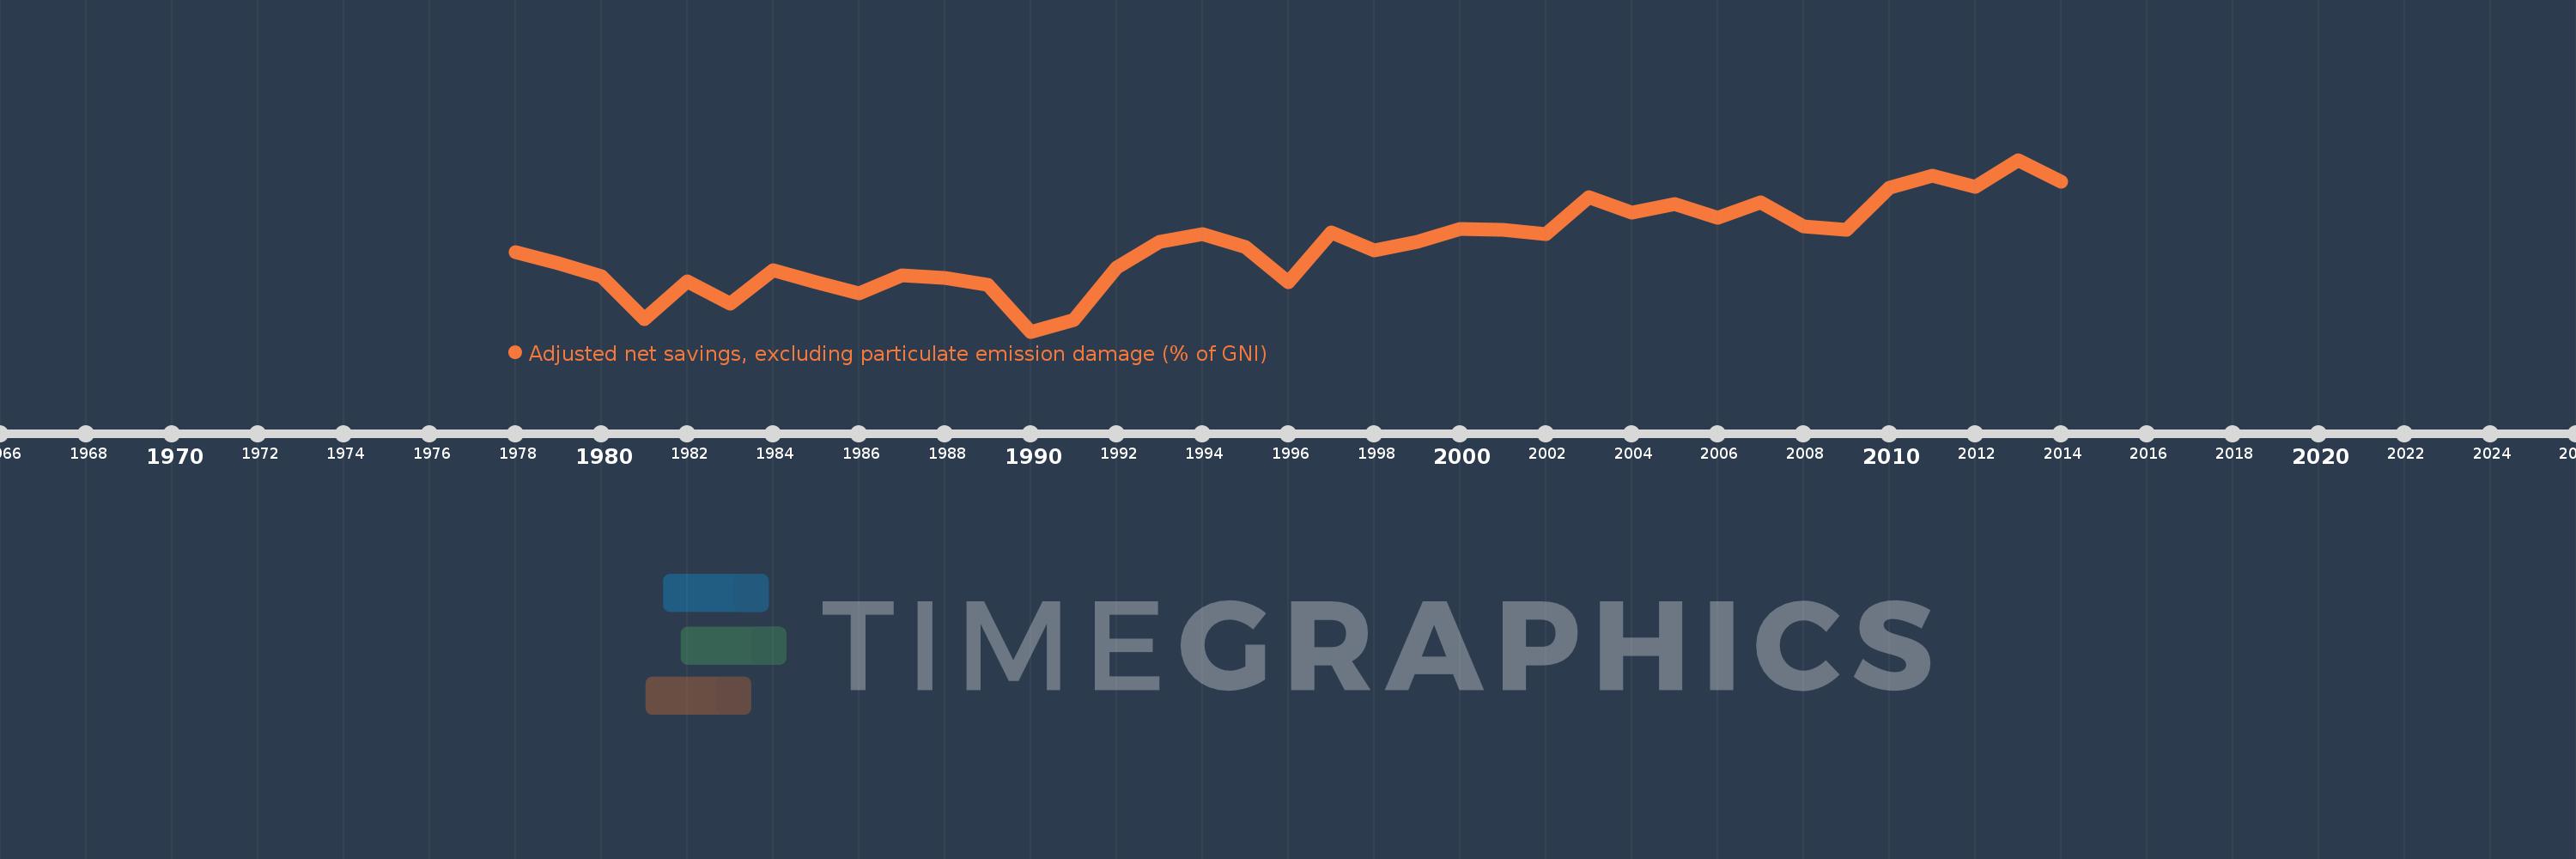
Adjusted net savings, excluding particulate emission damage (% of GNI)
2014,2013,2012,2011,2010,2009,2008,2007,2006,2005,2004,2003,2002,2001,2000,1999,1998,1997,1996,1995,1994,1993,1992,1991,1990,1989,1988,1987,1986,1985,1984,1983,1982,1981,1980,1979,1978
Estas estatísticas em outros países:
AfghanistanAlbaniaAlgeriaAngolaArab WorldArgentinaArmeniaAustraliaAustriaAzerbaijanBahamas, TheBahrainBangladeshBarbadosBelarusBelgiumBelizeBeninBhutanBoliviaBotswanaBrazilBrunei DarussalamBulgariaBurkina FasoBurundiCabo VerdeCambodiaCameroonCanadaCaribbean small statesCentral African RepublicCentral Europe and the BalticsChadChileChinaColombiaComorosCongo, Dem. Rep.Congo, Rep.Costa RicaCote d'IvoireCroatiaCyprusCzech RepublicDenmarkDjiboutiDominicaDominican RepublicEarly-demographic dividendEast Asia & PacificEast Asia & Pacific (excluding high income)East Asia & Pacific (IDA & IBRD countries)EcuadorEgypt, Arab Rep.El SalvadorEquatorial GuineaEritreaEstoniaEthiopiaEuro areaEurope & Central AsiaEurope & Central Asia (excluding high income)Europe & Central Asia (IDA & IBRD countries)European UnionFijiFinlandFragile and conflict affected situationsFranceGabonGambia, TheGeorgiaGermanyGhanaGreeceGuatemalaGuineaGuinea-BissauGuyanaHaitiHeavily indebted poor countries (HIPC)High incomeHondurasHungaryIBRD onlyIcelandIDA & IBRD totalIDA blendIDA onlyIDA totalIndiaIndonesiaIran, Islamic Rep.IraqIrelandIsraelItalyJamaicaJapanJordanKazakhstanKenyaKiribatiKorea, Rep.KuwaitKyrgyz RepublicLao PDRLate-demographic dividendLatin America & Caribbean Latin America & Caribbean (excluding high income)Latin America & the Caribbean (IDA & IBRD countries)LatviaLeast developed countries: UN classificationLebanonLesothoLiberiaLibyaLithuaniaLow & middle incomeLow incomeLower middle incomeLuxembourgMacedonia, FYRMadagascarMalawiMalaysiaMaldivesMaliMauritaniaMauritiusMexicoMiddle East & North AfricaMiddle East & North Africa (excluding high income)Middle East & North Africa (IDA & IBRD countries)Middle incomeMoldovaMongoliaMoroccoMozambiqueNamibiaNepalNetherlandsNew ZealandNicaraguaNigerNigeriaNorth AmericaNorwayOECD membersOmanOther small statesPacific island small statesPakistanPanamaPapua New GuineaParaguayPeruPhilippinesPolandPortugalPost-demographic dividendPre-demographic dividendQatarRomaniaRussian FederationRwandaSaudi ArabiaSenegalSeychellesSierra LeoneSingaporeSlovak RepublicSloveniaSmall statesSolomon IslandsSouth AfricaSouth AsiaSouth Asia (IDA & IBRD)SpainSri LankaSt. LuciaSt. Vincent and the GrenadinesSub-Saharan Africa Sub-Saharan Africa (excluding high income)Sub-Saharan Africa (IDA & IBRD countries)SudanSurinameSwazilandSwedenSwitzerlandSyrian Arab RepublicTajikistanTanzaniaThailandTogoTongaTrinidad and TobagoTunisiaTurkeyUgandaUkraineUnited KingdomUnited StatesUpper middle incomeUruguayVanuatuVenezuela, RBVietnamWorldYemen, Rep.ZambiaZimbabwe Linha do tempo:
Nesta escala de tempo está apresentado um gráfico de 1978 ano até 2014 ano Least developed countries: UN classification. Dados de 1977 ano ausente. O número de observações reais por data: 37.
Fonte (nome):
Indicadores de desenvolvimento mundial
Fonte (organização):
World Bank staff estimates based on sources and methods in World Bank's "The Changing Wealth of Nations: Measuring Sustainable Development in the New Millennium" (2011).
Categorias:
Economy & Growth, Environment
Foi atualizado:
23 abr 2017 ano
Indicadores de alterações dos valores ao longo dos anos
Mínimo:
-4.55
1 jan 1990 ano
Máximo:
10.83
1 jan 2013 ano
Na data de observação
Valor
Mudança absoluta
A alteração em relação ao valor anterior
1 jan 1978 ano
2.547
+2.547
0.0%
1 jan 1979 ano
1.595
-0.952
-37.36%
1 jan 1980 ano
0.415
-1.18
-73.99%
1 jan 1981 ano
-3.405
-3.82
-920.79%
1 jan 1982 ano
-0.075
+3.33
-97.79%
1 jan 1983 ano
-2.06
-1.985
2.64 mil%
1 jan 1984 ano
0.947
+3.007
-145.99%
1 jan 1985 ano
-0.133
-1.08
-114.03%
1 jan 1986 ano
-1.146
-1.013
761.84%
1 jan 1987 ano
0.449
+1.595
-139.18%
1 jan 1988 ano
0.262
-0.187
-41.63%
1 jan 1989 ano
-0.347
-0.609
-232.33%
1 jan 1990 ano
-4.55
-4.203
1.21 mil%
1 jan 1991 ano
-3.522
+1.028
-22.59%
1 jan 1992 ano
1.145
+4.667
-132.51%
1 jan 1993 ano
3.478
+2.333
203.72%
1 jan 1994 ano
4.215
+0.738
21.21%
1 jan 1995 ano
3.063
-1.152
-27.34%
1 jan 1996 ano
-0.112
-3.175
-103.67%
1 jan 1997 ano
4.302
+4.414
-3.93 mil%
1 jan 1998 ano
2.718
-1.584
-36.82%
1 jan 1999 ano
3.507
+0.79
29.06%
1 jan 2000 ano
4.654
+1.147
32.7%
1 jan 2001 ano
4.573
-0.081
-1.74%
1 jan 2002 ano
4.204
-0.369
-8.08%
1 jan 2003 ano
7.502
+3.298
78.46%
1 jan 2004 ano
6.074
-1.429
-19.04%
1 jan 2005 ano
6.85
+0.776
12.78%
1 jan 2006 ano
5.64
-1.21
-17.66%
1 jan 2007 ano
7.028
+1.388
24.61%
1 jan 2008 ano
4.889
-2.139
-30.43%
1 jan 2009 ano
4.592
-0.297
-6.08%
1 jan 2010 ano
8.342
+3.75
81.66%
1 jan 2011 ano
9.391
+1.049
12.58%
1 jan 2012 ano
8.413
-0.978
-10.42%
1 jan 2013 ano
10.83
+2.417
28.73%
1 jan 2014 ano
8.882
-1.947
-17.98%
Classificação de países por estatísticas atuais por anos


Comentários: