29
/pt/
pt
AIzaSyAYiBZKx7MnpbEhh9jyipgxe19OcubqV5w
April 1, 2024
209018
New Zealand
NZL
true
2
1
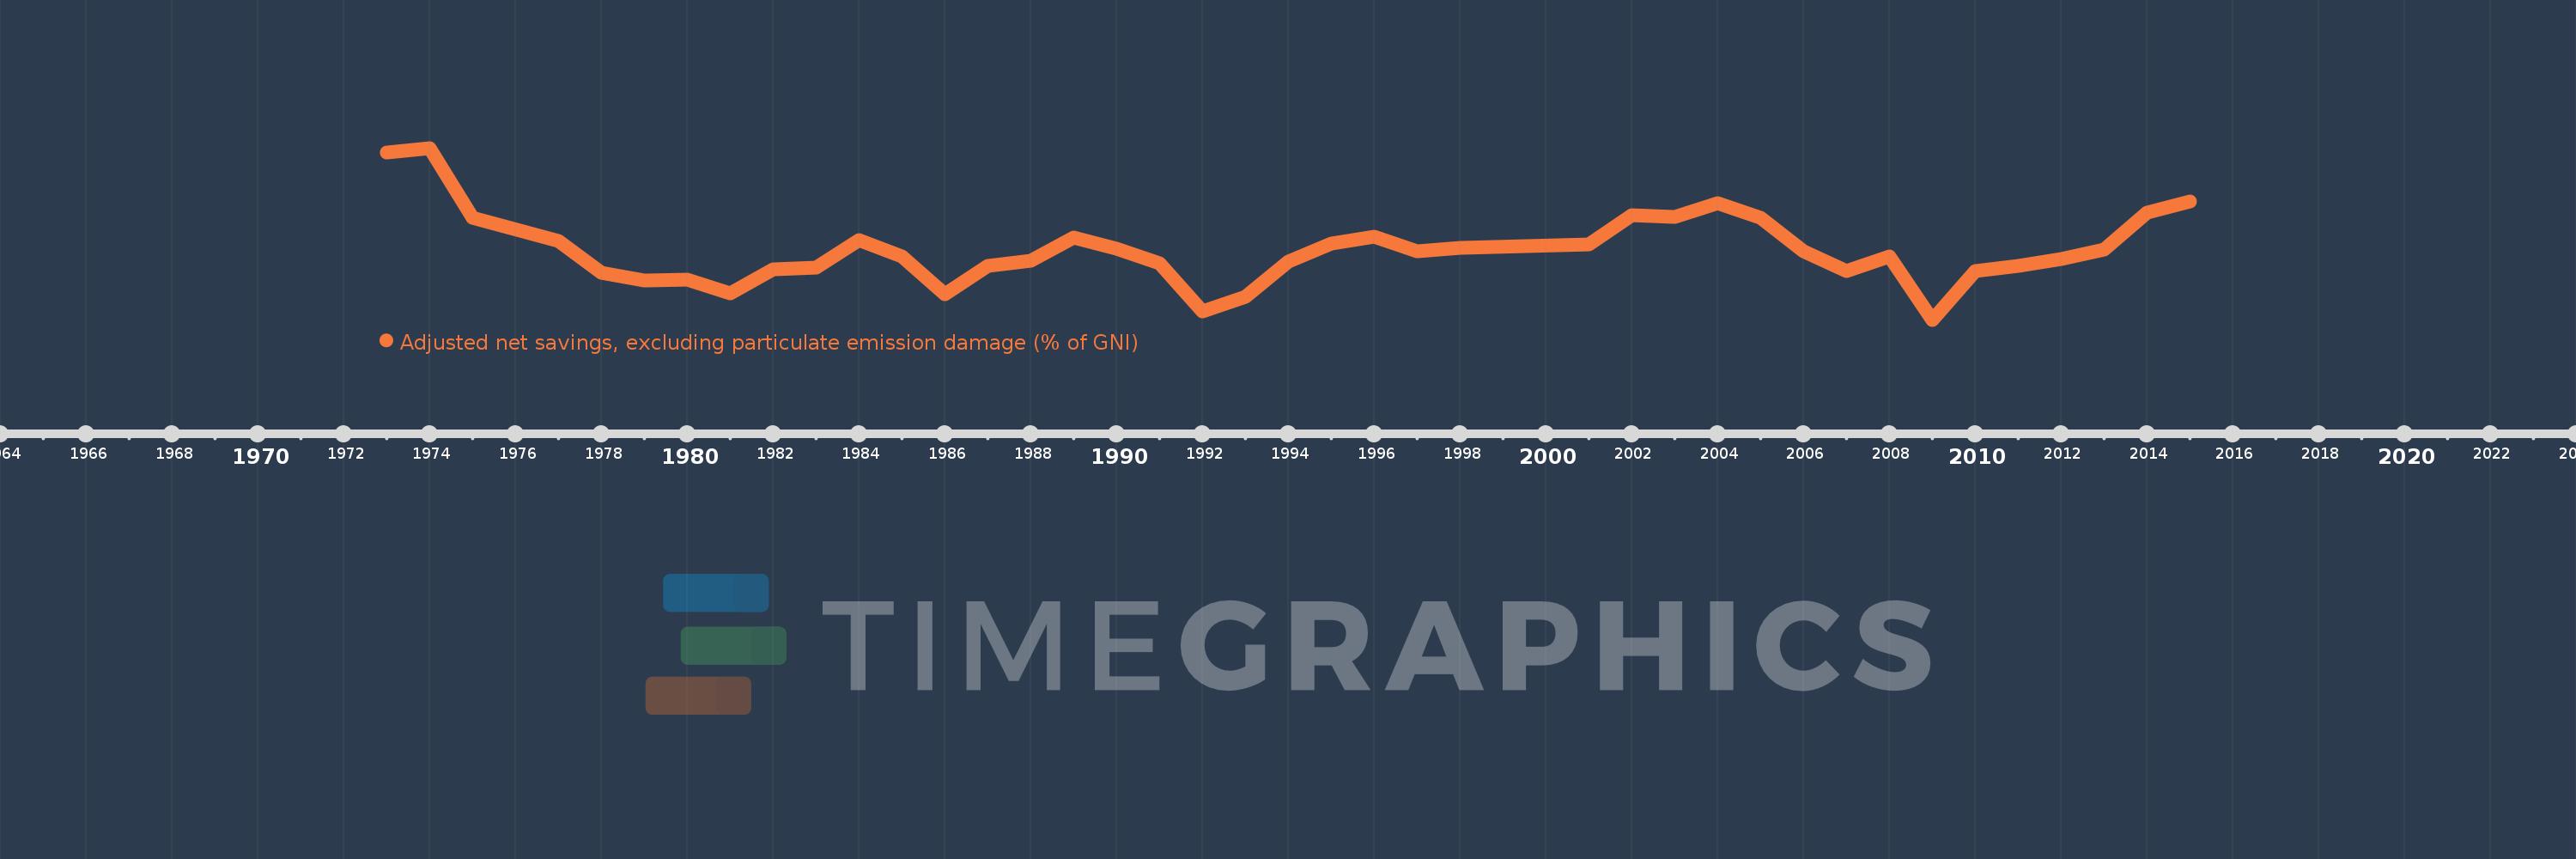
Adjusted net savings, excluding particulate emission damage (% of GNI)
2015,2014,2013,2012,2011,2010,2009,2008,2007,2006,2005,2004,2003,2002,2001,1998,1997,1996,1995,1994,1993,1992,1991,1990,1989,1988,1987,1986,1985,1984,1983,1982,1981,1980,1979,1978,1977,1975,1974,1973
Estas estatísticas em outros países:
AfghanistanAlbaniaAlgeriaAngolaArab WorldArgentinaArmeniaAustraliaAustriaAzerbaijanBahamas, TheBahrainBangladeshBarbadosBelarusBelgiumBelizeBeninBhutanBoliviaBotswanaBrazilBrunei DarussalamBulgariaBurkina FasoBurundiCabo VerdeCambodiaCameroonCanadaCaribbean small statesCentral African RepublicCentral Europe and the BalticsChadChileChinaColombiaComorosCongo, Dem. Rep.Congo, Rep.Costa RicaCote d'IvoireCroatiaCyprusCzech RepublicDenmarkDjiboutiDominicaDominican RepublicEarly-demographic dividendEast Asia & PacificEast Asia & Pacific (excluding high income)East Asia & Pacific (IDA & IBRD countries)EcuadorEgypt, Arab Rep.El SalvadorEquatorial GuineaEritreaEstoniaEthiopiaEuro areaEurope & Central AsiaEurope & Central Asia (excluding high income)Europe & Central Asia (IDA & IBRD countries)European UnionFijiFinlandFragile and conflict affected situationsFranceGabonGambia, TheGeorgiaGermanyGhanaGreeceGuatemalaGuineaGuinea-BissauGuyanaHaitiHeavily indebted poor countries (HIPC)High incomeHondurasHungaryIBRD onlyIcelandIDA & IBRD totalIDA blendIDA onlyIDA totalIndiaIndonesiaIran, Islamic Rep.IraqIrelandIsraelItalyJamaicaJapanJordanKazakhstanKenyaKiribatiKorea, Rep.KuwaitKyrgyz RepublicLao PDRLate-demographic dividendLatin America & Caribbean Latin America & Caribbean (excluding high income)Latin America & the Caribbean (IDA & IBRD countries)LatviaLeast developed countries: UN classificationLebanonLesothoLiberiaLibyaLithuaniaLow & middle incomeLow incomeLower middle incomeLuxembourgMacedonia, FYRMadagascarMalawiMalaysiaMaldivesMaliMauritaniaMauritiusMexicoMiddle East & North AfricaMiddle East & North Africa (excluding high income)Middle East & North Africa (IDA & IBRD countries)Middle incomeMoldovaMongoliaMoroccoMozambiqueNamibiaNepalNetherlandsNew ZealandNicaraguaNigerNigeriaNorth AmericaNorwayOECD membersOmanOther small statesPacific island small statesPakistanPanamaPapua New GuineaParaguayPeruPhilippinesPolandPortugalPost-demographic dividendPre-demographic dividendQatarRomaniaRussian FederationRwandaSaudi ArabiaSenegalSeychellesSierra LeoneSingaporeSlovak RepublicSloveniaSmall statesSolomon IslandsSouth AfricaSouth AsiaSouth Asia (IDA & IBRD)SpainSri LankaSt. LuciaSt. Vincent and the GrenadinesSub-Saharan Africa Sub-Saharan Africa (excluding high income)Sub-Saharan Africa (IDA & IBRD countries)SudanSurinameSwazilandSwedenSwitzerlandSyrian Arab RepublicTajikistanTanzaniaThailandTogoTongaTrinidad and TobagoTunisiaTurkeyUgandaUkraineUnited KingdomUnited StatesUpper middle incomeUruguayVanuatuVenezuela, RBVietnamWorldYemen, Rep.ZambiaZimbabwe Linha do tempo:
Nesta escala de tempo está apresentado um gráfico de 1973 ano até 2015 ano New Zealand. Dados de 1972 ano ausente. O número de observações reais por data: 40.
Fonte (nome):
Indicadores de desenvolvimento mundial
Fonte (organização):
World Bank staff estimates based on sources and methods in World Bank's "The Changing Wealth of Nations: Measuring Sustainable Development in the New Millennium" (2011).
Categorias:
Economy & Growth, Environment
Foi atualizado:
23 abr 2017 ano
Indicadores de alterações dos valores ao longo dos anos
Mínimo:
3.121
1 jan 2009 ano
Máximo:
18.751
1 jan 1974 ano
Na data de observação
Valor
Mudança absoluta
A alteração em relação ao valor anterior
1 jan 1973 ano
18.319
+18.319
0.0%
1 jan 1974 ano
18.751
+0.432
2.36%
1 jan 1975 ano
12.409
-6.341
-33.82%
1 jan 1977 ano
10.264
-2.145
-17.29%
1 jan 1978 ano
7.38
-2.884
-28.1%
1 jan 1979 ano
6.699
-0.681
-9.23%
1 jan 1980 ano
6.798
+0.1
1.49%
1 jan 1981 ano
5.55
-1.248
-18.36%
1 jan 1982 ano
7.691
+2.141
38.57%
1 jan 1983 ano
7.871
+0.18
2.34%
1 jan 1984 ano
10.384
+2.514
31.93%
1 jan 1985 ano
8.861
-1.523
-14.67%
1 jan 1986 ano
5.454
-3.407
-38.45%
1 jan 1987 ano
8.027
+2.572
47.16%
1 jan 1988 ano
8.484
+0.458
5.7%
1 jan 1989 ano
10.59
+2.106
24.82%
1 jan 1990 ano
9.617
-0.973
-9.19%
1 jan 1991 ano
8.218
-1.399
-14.55%
1 jan 1992 ano
3.845
-4.373
-53.21%
1 jan 1993 ano
5.219
+1.374
35.73%
1 jan 1994 ano
8.418
+3.199
61.31%
1 jan 1995 ano
10.069
+1.651
19.61%
1 jan 1996 ano
10.662
+0.593
5.89%
1 jan 1997 ano
9.331
-1.331
-12.48%
1 jan 1998 ano
9.655
+0.323
3.46%
1 jan 2001 ano
9.951
+0.296
3.07%
1 jan 2002 ano
12.61
+2.659
26.72%
1 jan 2003 ano
12.492
-0.117
-0.93%
1 jan 2004 ano
13.758
+1.265
10.13%
1 jan 2005 ano
12.422
-1.336
-9.71%
1 jan 2006 ano
9.32
-3.102
-24.97%
1 jan 2007 ano
7.564
-1.756
-18.84%
1 jan 2008 ano
8.907
+1.343
17.76%
1 jan 2009 ano
3.121
-5.786
-64.96%
1 jan 2010 ano
7.588
+4.467
143.14%
1 jan 2011 ano
8.051
+0.463
6.11%
1 jan 2012 ano
8.619
+0.569
7.06%
1 jan 2013 ano
9.501
+0.882
10.23%
1 jan 2014 ano
12.834
+3.333
35.08%
1 jan 2015 ano
13.882
+1.048
8.16%
Classificação de países por estatísticas atuais por anos


Comentários: