29
/pt/
pt
AIzaSyAYiBZKx7MnpbEhh9jyipgxe19OcubqV5w
April 1, 2024
59774
Sub-Saharan Africa (excluding high income)
SSA
false
2
1
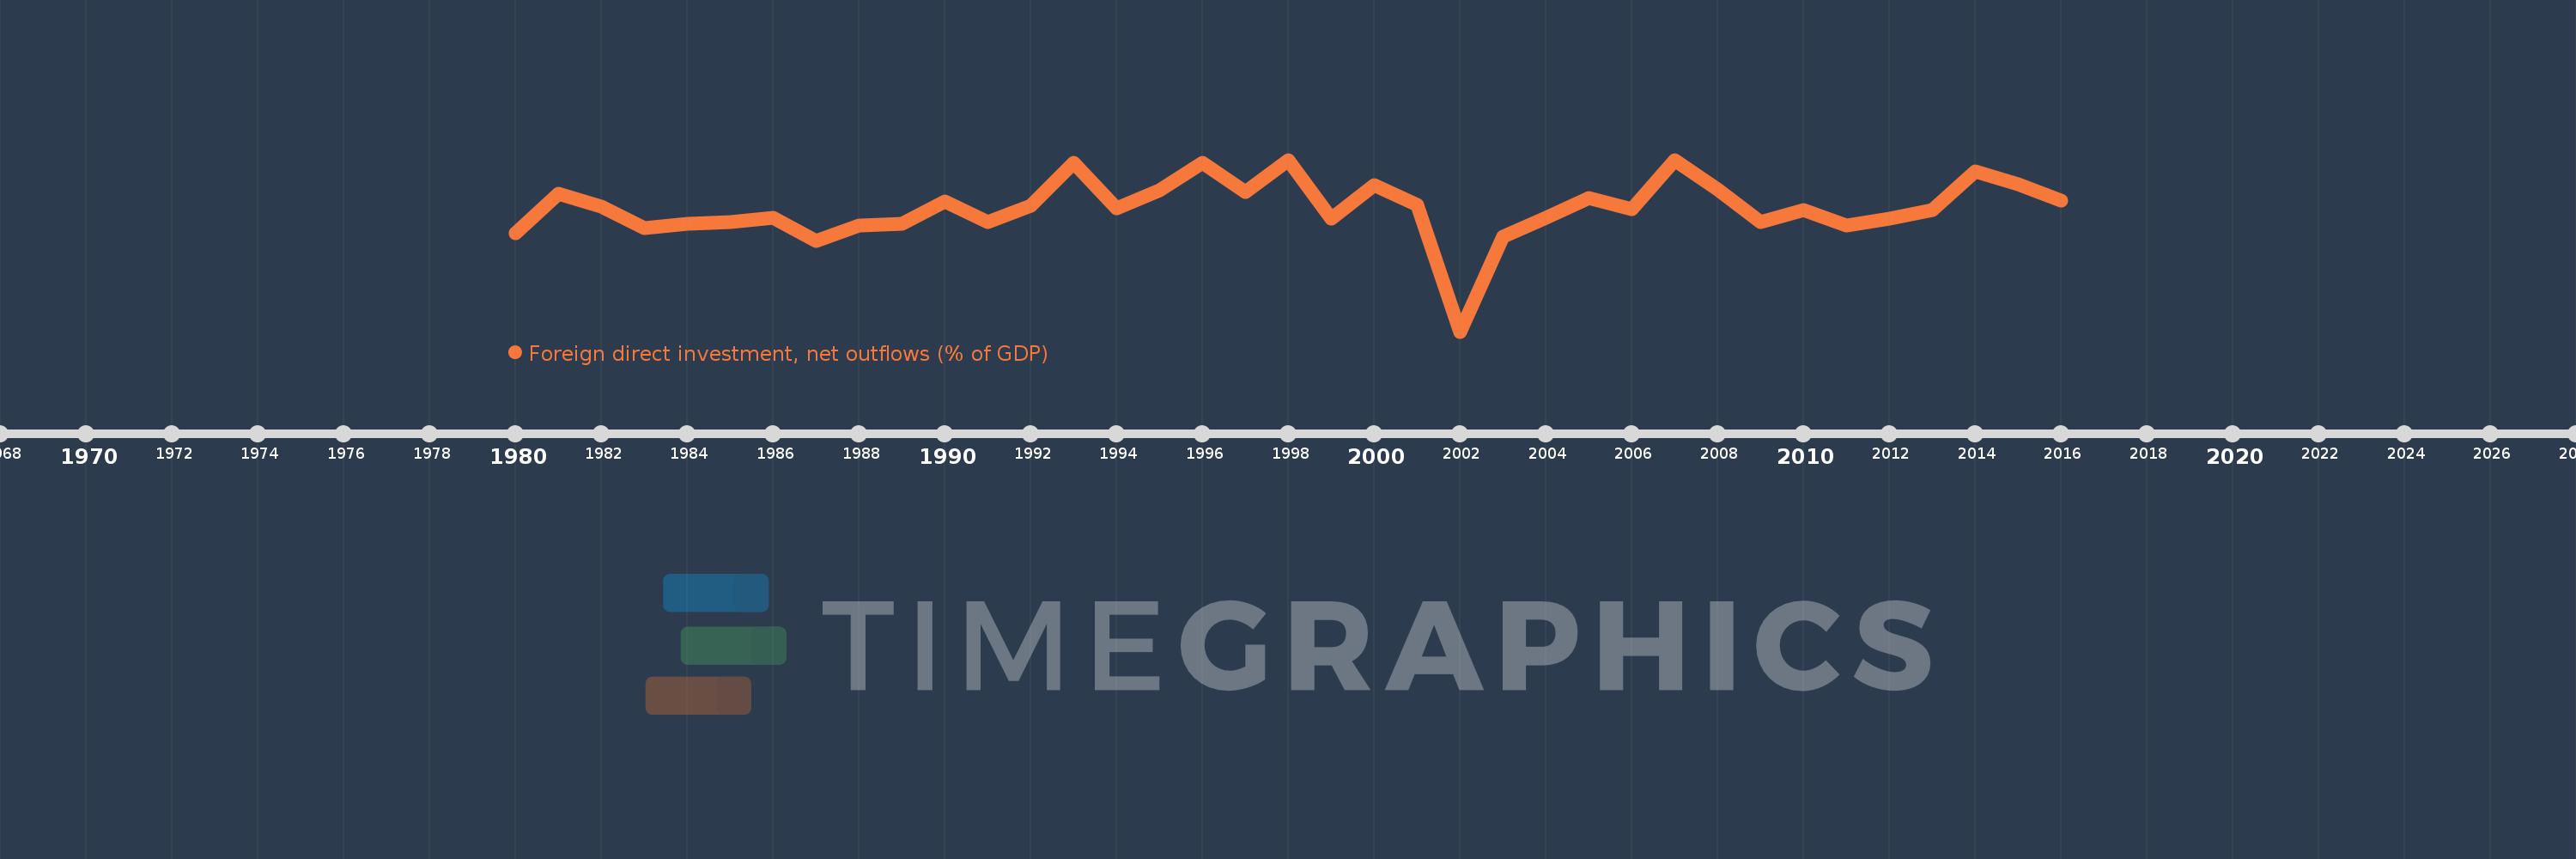
Foreign direct investment, net outflows (% of GDP)
2016,2015,2014,2013,2012,2011,2010,2009,2008,2007,2006,2005,2004,2003,2002,2001,2000,1999,1998,1997,1996,1995,1994,1993,1992,1991,1990,1989,1988,1987,1986,1985,1984,1983,1982,1981,1980
Estas estatísticas em outros países:
AfghanistanAlbaniaAlgeriaAngolaAntigua and BarbudaArab WorldArgentinaArmeniaArubaAustraliaAustriaAzerbaijanBahamas, TheBahrainBangladeshBarbadosBelarusBelgiumBelizeBeninBermudaBoliviaBosnia and HerzegovinaBotswanaBrazilBrunei DarussalamBulgariaBurkina FasoBurundiCabo VerdeCambodiaCameroonCanadaCaribbean small statesCayman IslandsCentral African RepublicCentral Europe and the BalticsChadChileChinaColombiaComorosCongo, Dem. Rep.Congo, Rep.Costa RicaCote d'IvoireCroatiaCyprusCzech RepublicDenmarkDominicaDominican RepublicEarly-demographic dividendEast Asia & PacificEast Asia & Pacific (excluding high income)East Asia & Pacific (IDA & IBRD countries)EcuadorEgypt, Arab Rep.El SalvadorEquatorial GuineaEritreaEstoniaEuro areaEurope & Central AsiaEurope & Central Asia (excluding high income)Europe & Central Asia (IDA & IBRD countries)European UnionFijiFinlandFragile and conflict affected situationsFranceFrench PolynesiaGabonGambia, TheGeorgiaGermanyGhanaGreeceGrenadaGuatemalaGuineaGuinea-BissauGuyanaHaitiHeavily indebted poor countries (HIPC)High incomeHondurasHong Kong SAR, ChinaHungaryIBRD onlyIcelandIDA & IBRD totalIDA blendIDA onlyIDA totalIndiaIndonesiaIran, Islamic Rep.IraqIrelandIsraelItalyJamaicaJapanJordanKazakhstanKenyaKiribatiKorea, Rep.KosovoKuwaitKyrgyz RepublicLao PDRLate-demographic dividendLatin America & Caribbean Latin America & Caribbean (excluding high income)Latin America & the Caribbean (IDA & IBRD countries)LatviaLeast developed countries: UN classificationLebanonLesothoLiberiaLibyaLithuaniaLow & middle incomeLow incomeLower middle incomeLuxembourgMacao SAR, ChinaMacedonia, FYRMadagascarMalawiMalaysiaMaliMaltaMarshall IslandsMauritaniaMauritiusMexicoMicronesia, Fed. Sts.Middle East & North AfricaMiddle East & North Africa (excluding high income)Middle East & North Africa (IDA & IBRD countries)Middle incomeMoldovaMongoliaMontenegroMoroccoMozambiqueNamibiaNauruNetherlandsNew ZealandNicaraguaNigerNigeriaNorth AmericaNorwayOECD membersOmanOther small statesPacific island small statesPakistanPalauPanamaPapua New GuineaParaguayPeruPhilippinesPolandPortugalPost-demographic dividendPre-demographic dividendQatarRomaniaRussian FederationRwandaSamoaSao Tome and PrincipeSaudi ArabiaSenegalSerbiaSeychellesSierra LeoneSingaporeSlovak RepublicSloveniaSmall statesSolomon IslandsSouth AfricaSouth AsiaSouth Asia (IDA & IBRD)SpainSri LankaSt. Kitts and NevisSt. LuciaSt. Vincent and the GrenadinesSub-Saharan Africa Sub-Saharan Africa (excluding high income)Sub-Saharan Africa (IDA & IBRD countries)SurinameSwazilandSwedenSwitzerlandSyrian Arab RepublicTajikistanTanzaniaThailandTimor-LesteTogoTongaTrinidad and TobagoTunisiaTurkeyUgandaUkraineUnited Arab EmiratesUnited KingdomUnited StatesUpper middle incomeUruguayVanuatuVenezuela, RBVietnamWest Bank and GazaWorldYemen, Rep.ZambiaZimbabwe Linha do tempo:
Nesta escala de tempo está apresentado um gráfico de 1980 ano até 2016 ano Sub-Saharan Africa (excluding high income). Dados de 1979 ano ausente. O número de observações reais por data: 37.
Fonte (nome):
Indicadores de desenvolvimento mundial
Fonte (organização):
International Monetary Fund, International Financial Statistics and Balance of Payments databases, World Bank, International Debt Statistics, and World Bank and OECD GDP estimates.
Categorias:
Economy & Growth, Financial Sector
Foi atualizado:
23 abr 2017 ano
Indicadores de alterações dos valores ao longo dos anos
Mínimo:
-1.329
1 jan 2002 ano
Máximo:
1.05
1 jan 2007 ano
Na data de observação
Valor
Mudança absoluta
A alteração em relação ao valor anterior
1 jan 1980 ano
0.029
+0.029
0.0%
1 jan 1981 ano
0.576
+0.548
1.9 mil%
1 jan 1982 ano
0.401
-0.175
-30.36%
1 jan 1983 ano
0.106
-0.295
-73.48%
1 jan 1984 ano
0.159
+0.053
49.53%
1 jan 1985 ano
0.191
+0.032
20.03%
1 jan 1986 ano
0.253
+0.062
32.21%
1 jan 1987 ano
-0.078
-0.33
-130.69%
1 jan 1988 ano
0.144
+0.221
-285.19%
1 jan 1989 ano
0.169
+0.026
17.85%
1 jan 1990 ano
0.471
+0.302
178.22%
1 jan 1991 ano
0.183
-0.288
-61.13%
1 jan 1992 ano
0.41
+0.227
123.97%
1 jan 1993 ano
1.007
+0.597
145.76%
1 jan 1994 ano
0.379
-0.628
-62.39%
1 jan 1995 ano
0.622
+0.243
64.17%
1 jan 1996 ano
1.005
+0.383
61.64%
1 jan 1997 ano
0.604
-0.401
-39.88%
1 jan 1998 ano
1.039
+0.435
71.95%
1 jan 1999 ano
0.231
-0.808
-77.73%
1 jan 2000 ano
0.701
+0.47
203.03%
1 jan 2001 ano
0.425
-0.276
-39.36%
1 jan 2002 ano
-1.329
-1.755
-412.78%
1 jan 2003 ano
-0.009
+1.32
-99.29%
1 jan 2004 ano
0.244
+0.253
-2.7 mil%
1 jan 2005 ano
0.515
+0.271
111.0%
1 jan 2006 ano
0.364
-0.151
-29.34%
1 jan 2007 ano
1.05
+0.686
188.45%
1 jan 2008 ano
0.636
-0.414
-39.42%
1 jan 2009 ano
0.193
-0.443
-69.7%
1 jan 2010 ano
0.356
+0.163
84.68%
1 jan 2011 ano
0.144
-0.212
-59.6%
1 jan 2012 ano
0.24
+0.097
67.19%
1 jan 2013 ano
0.349
+0.109
45.16%
1 jan 2014 ano
0.885
+0.536
153.71%
1 jan 2015 ano
0.71
-0.175
-19.81%
1 jan 2016 ano
0.489
-0.221
-31.07%
Classificação de países por estatísticas atuais por anos


Comentários: