29
/pt/
pt
AIzaSyAYiBZKx7MnpbEhh9jyipgxe19OcubqV5w
April 1, 2024
133127
Finland
FIN
true
2
1
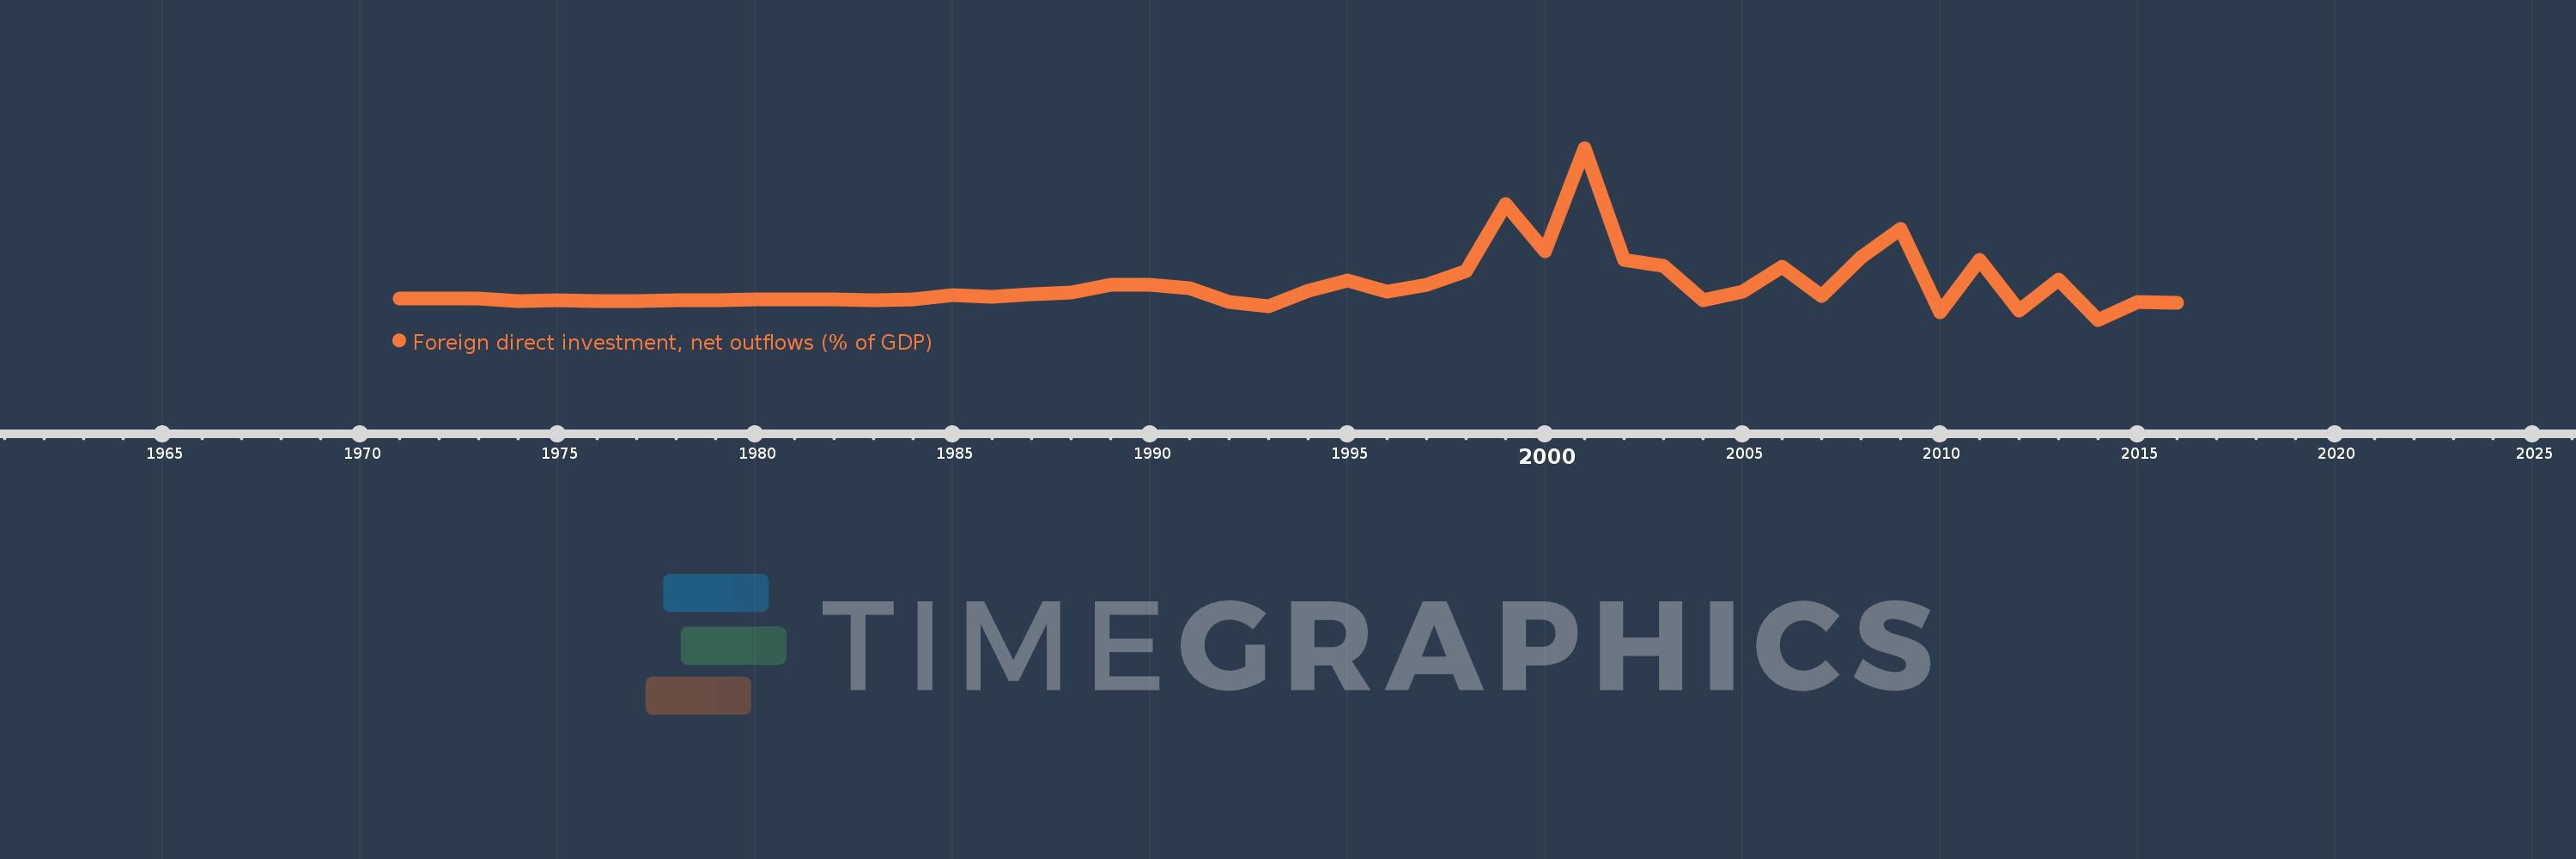
Foreign direct investment, net outflows (% of GDP)
2016,2015,2014,2013,2012,2011,2010,2009,2008,2007,2006,2005,2004,2003,2002,2001,2000,1999,1998,1997,1996,1995,1994,1993,1992,1991,1990,1989,1988,1987,1986,1985,1984,1983,1982,1981,1980,1979,1978,1977,1976,1975,1974,1973,1972,1971
Estas estatísticas em outros países:
AfghanistanAlbaniaAlgeriaAngolaAntigua and BarbudaArab WorldArgentinaArmeniaArubaAustraliaAustriaAzerbaijanBahamas, TheBahrainBangladeshBarbadosBelarusBelgiumBelizeBeninBermudaBoliviaBosnia and HerzegovinaBotswanaBrazilBrunei DarussalamBulgariaBurkina FasoBurundiCabo VerdeCambodiaCameroonCanadaCaribbean small statesCayman IslandsCentral African RepublicCentral Europe and the BalticsChadChileChinaColombiaComorosCongo, Dem. Rep.Congo, Rep.Costa RicaCote d'IvoireCroatiaCyprusCzech RepublicDenmarkDominicaDominican RepublicEarly-demographic dividendEast Asia & PacificEast Asia & Pacific (excluding high income)East Asia & Pacific (IDA & IBRD countries)EcuadorEgypt, Arab Rep.El SalvadorEquatorial GuineaEritreaEstoniaEuro areaEurope & Central AsiaEurope & Central Asia (excluding high income)Europe & Central Asia (IDA & IBRD countries)European UnionFijiFinlandFragile and conflict affected situationsFranceFrench PolynesiaGabonGambia, TheGeorgiaGermanyGhanaGreeceGrenadaGuatemalaGuineaGuinea-BissauGuyanaHaitiHeavily indebted poor countries (HIPC)High incomeHondurasHong Kong SAR, ChinaHungaryIBRD onlyIcelandIDA & IBRD totalIDA blendIDA onlyIDA totalIndiaIndonesiaIran, Islamic Rep.IraqIrelandIsraelItalyJamaicaJapanJordanKazakhstanKenyaKiribatiKorea, Rep.KosovoKuwaitKyrgyz RepublicLao PDRLate-demographic dividendLatin America & Caribbean Latin America & Caribbean (excluding high income)Latin America & the Caribbean (IDA & IBRD countries)LatviaLeast developed countries: UN classificationLebanonLesothoLiberiaLibyaLithuaniaLow & middle incomeLow incomeLower middle incomeLuxembourgMacao SAR, ChinaMacedonia, FYRMadagascarMalawiMalaysiaMaliMaltaMarshall IslandsMauritaniaMauritiusMexicoMicronesia, Fed. Sts.Middle East & North AfricaMiddle East & North Africa (excluding high income)Middle East & North Africa (IDA & IBRD countries)Middle incomeMoldovaMongoliaMontenegroMoroccoMozambiqueNamibiaNauruNetherlandsNew ZealandNicaraguaNigerNigeriaNorth AmericaNorwayOECD membersOmanOther small statesPacific island small statesPakistanPalauPanamaPapua New GuineaParaguayPeruPhilippinesPolandPortugalPost-demographic dividendPre-demographic dividendQatarRomaniaRussian FederationRwandaSamoaSao Tome and PrincipeSaudi ArabiaSenegalSerbiaSeychellesSierra LeoneSingaporeSlovak RepublicSloveniaSmall statesSolomon IslandsSouth AfricaSouth AsiaSouth Asia (IDA & IBRD)SpainSri LankaSt. Kitts and NevisSt. LuciaSt. Vincent and the GrenadinesSub-Saharan Africa Sub-Saharan Africa (excluding high income)Sub-Saharan Africa (IDA & IBRD countries)SurinameSwazilandSwedenSwitzerlandSyrian Arab RepublicTajikistanTanzaniaThailandTimor-LesteTogoTongaTrinidad and TobagoTunisiaTurkeyUgandaUkraineUnited Arab EmiratesUnited KingdomUnited StatesUpper middle incomeUruguayVanuatuVenezuela, RBVietnamWest Bank and GazaWorldYemen, Rep.ZambiaZimbabwe Linha do tempo:
Nesta escala de tempo está apresentado um gráfico de 1971 ano até 2016 ano Finland. Dados de 1970 ano ausente. O número de observações reais por data: 46.
Fonte (nome):
Indicadores de desenvolvimento mundial
Fonte (organização):
International Monetary Fund, International Financial Statistics and Balance of Payments databases, World Bank, International Debt Statistics, and World Bank and OECD GDP estimates.
Categorias:
Economy & Growth, Financial Sector
Foi atualizado:
23 abr 2017 ano
Indicadores de alterações dos valores ao longo dos anos
Mínimo:
-2.683
1 jan 2014 ano
Máximo:
22.52
1 jan 2001 ano
Na data de observação
Valor
Mudança absoluta
A alteração em relação ao valor anterior
1 jan 1971 ano
0.458
+0.458
0.0%
1 jan 1972 ano
0.367
-0.091
-19.8%
1 jan 1973 ano
0.413
+0.047
12.68%
1 jan 1974 ano
0.077
-0.336
-81.38%
1 jan 1975 ano
0.117
+0.04
51.5%
1 jan 1976 ano
0.088
-0.029
-24.48%
1 jan 1977 ano
0.096
+0.008
8.72%
1 jan 1978 ano
0.215
+0.12
124.88%
1 jan 1979 ano
0.172
-0.043
-19.97%
1 jan 1980 ano
0.281
+0.109
63.04%
1 jan 1981 ano
0.255
-0.026
-9.33%
1 jan 1982 ano
0.246
-0.009
-3.6%
1 jan 1983 ano
0.148
-0.098
-39.77%
1 jan 1984 ano
0.272
+0.124
83.62%
1 jan 1985 ano
0.93
+0.658
242.35%
1 jan 1986 ano
0.622
-0.308
-33.09%
1 jan 1987 ano
1.112
+0.489
78.65%
1 jan 1988 ano
1.255
+0.143
12.87%
1 jan 1989 ano
2.405
+1.151
91.7%
1 jan 1990 ano
2.493
+0.088
3.65%
1 jan 1991 ano
1.966
-0.527
-21.13%
1 jan 1992 ano
-0.094
-2.06
-104.77%
1 jan 1993 ano
-0.672
-0.578
616.33%
1 jan 1994 ano
1.57
+2.242
-333.6%
1 jan 1995 ano
3.035
+1.465
93.29%
1 jan 1996 ano
1.416
-1.619
-53.33%
1 jan 1997 ano
2.436
+1.019
71.97%
1 jan 1998 ano
4.404
+1.968
80.81%
1 jan 1999 ano
14.323
+9.919
225.23%
1 jan 2000 ano
7.312
-7.011
-48.95%
1 jan 2001 ano
22.52
+15.208
207.98%
1 jan 2002 ano
6.144
-16.377
-72.72%
1 jan 2003 ano
5.251
-0.893
-14.54%
1 jan 2004 ano
0.128
-5.122
-97.56%
1 jan 2005 ano
1.4
+1.272
991.48%
1 jan 2006 ano
5.129
+3.729
266.4%
1 jan 2007 ano
0.828
-4.301
-83.86%
1 jan 2008 ano
6.47
+5.642
681.45%
1 jan 2009 ano
10.622
+4.152
64.17%
1 jan 2010 ano
-1.554
-12.175
-114.63%
1 jan 2011 ano
6.05
+7.604
-489.34%
1 jan 2012 ano
-1.298
-7.348
-121.46%
1 jan 2013 ano
3.264
+4.562
-351.42%
1 jan 2014 ano
-2.683
-5.947
-182.21%
1 jan 2015 ano
-0.061
+2.622
-97.73%
1 jan 2016 ano
-0.22
-0.159
259.95%
Classificação de países por estatísticas atuais por anos


Comentários: