29
/pt/
pt
AIzaSyAYiBZKx7MnpbEhh9jyipgxe19OcubqV5w
April 1, 2024
195533
Mexico
MEX
true
2
1
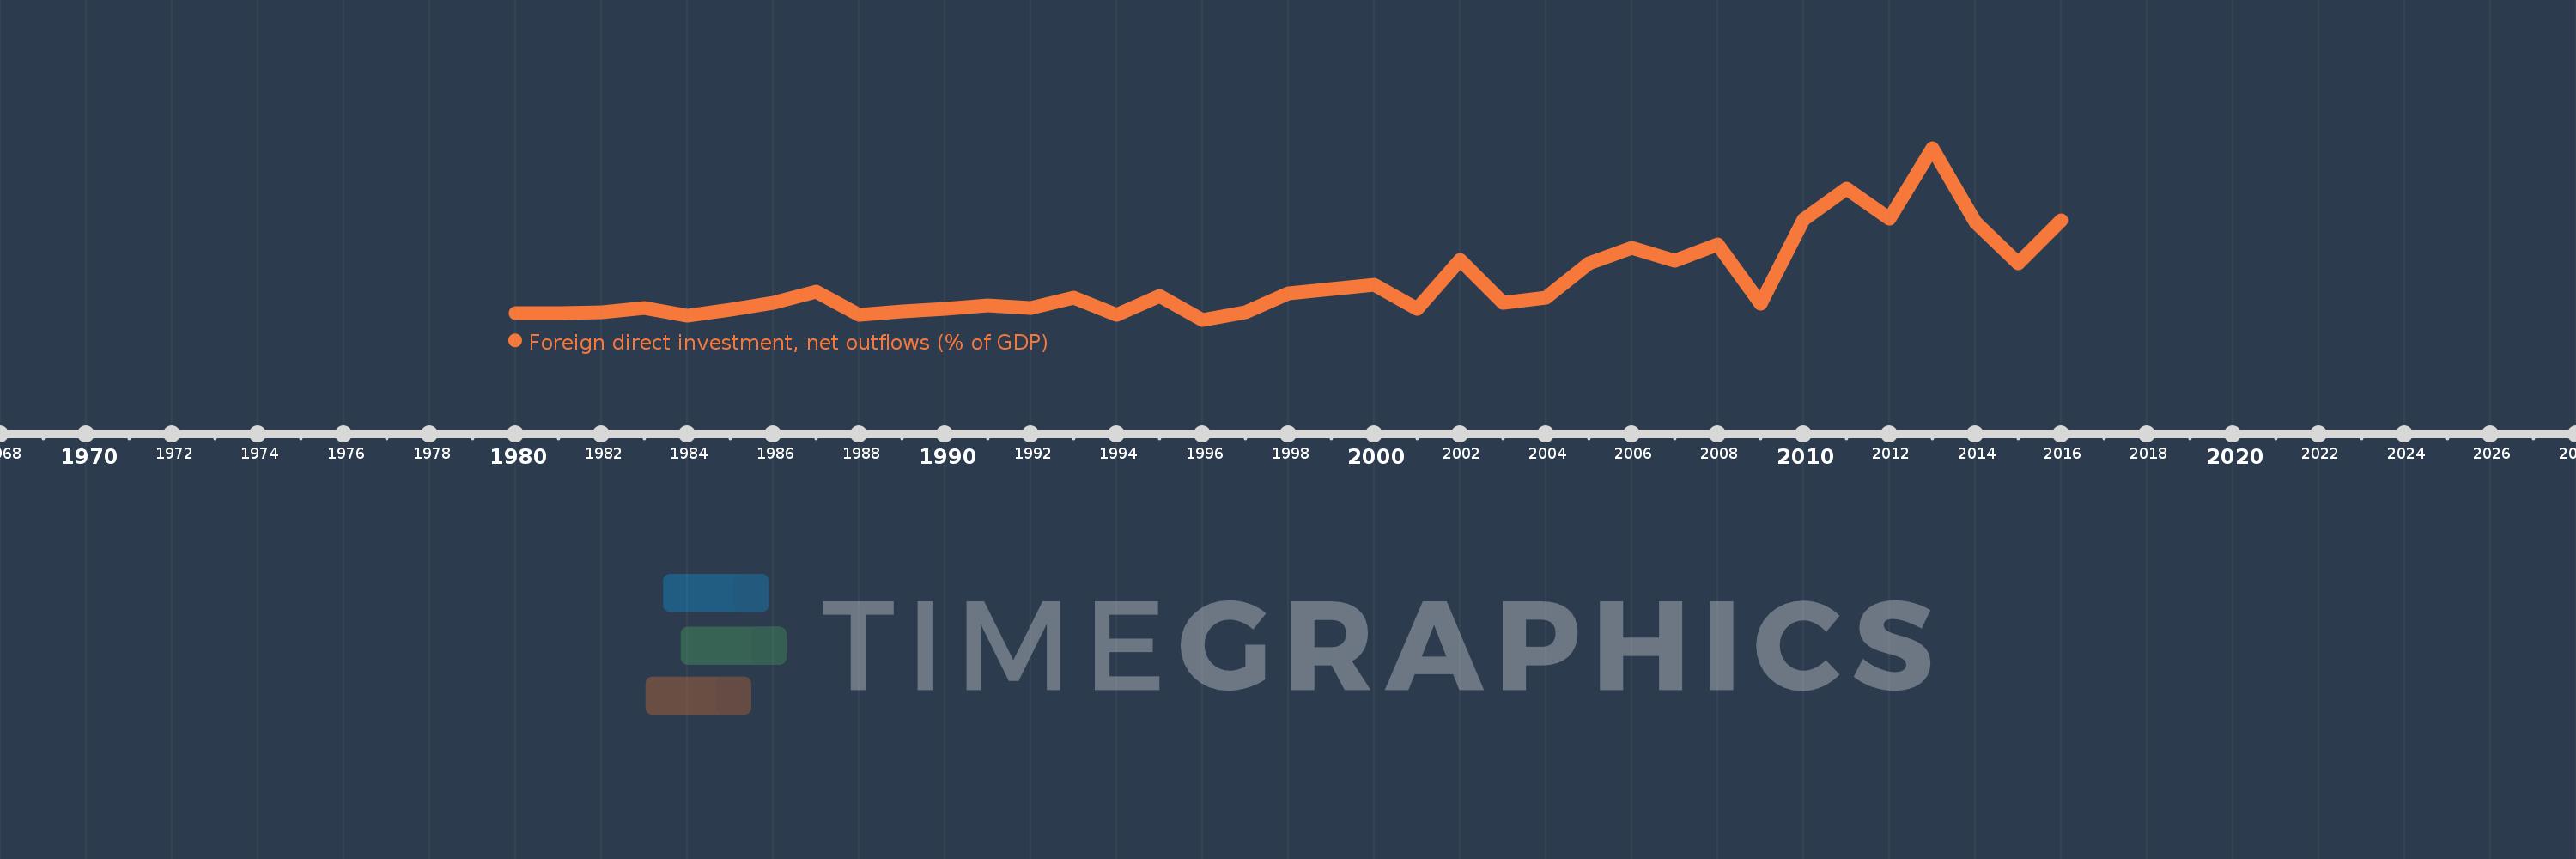
Foreign direct investment, net outflows (% of GDP)
2016,2015,2014,2013,2012,2011,2010,2009,2008,2007,2006,2005,2004,2003,2002,2001,2000,1999,1998,1997,1996,1995,1994,1993,1992,1991,1990,1989,1988,1987,1986,1985,1984,1983,1982,1981,1980
Estas estatísticas em outros países:
AfghanistanAlbaniaAlgeriaAngolaAntigua and BarbudaArab WorldArgentinaArmeniaArubaAustraliaAustriaAzerbaijanBahamas, TheBahrainBangladeshBarbadosBelarusBelgiumBelizeBeninBermudaBoliviaBosnia and HerzegovinaBotswanaBrazilBrunei DarussalamBulgariaBurkina FasoBurundiCabo VerdeCambodiaCameroonCanadaCaribbean small statesCayman IslandsCentral African RepublicCentral Europe and the BalticsChadChileChinaColombiaComorosCongo, Dem. Rep.Congo, Rep.Costa RicaCote d'IvoireCroatiaCyprusCzech RepublicDenmarkDominicaDominican RepublicEarly-demographic dividendEast Asia & PacificEast Asia & Pacific (excluding high income)East Asia & Pacific (IDA & IBRD countries)EcuadorEgypt, Arab Rep.El SalvadorEquatorial GuineaEritreaEstoniaEuro areaEurope & Central AsiaEurope & Central Asia (excluding high income)Europe & Central Asia (IDA & IBRD countries)European UnionFijiFinlandFragile and conflict affected situationsFranceFrench PolynesiaGabonGambia, TheGeorgiaGermanyGhanaGreeceGrenadaGuatemalaGuineaGuinea-BissauGuyanaHaitiHeavily indebted poor countries (HIPC)High incomeHondurasHong Kong SAR, ChinaHungaryIBRD onlyIcelandIDA & IBRD totalIDA blendIDA onlyIDA totalIndiaIndonesiaIran, Islamic Rep.IraqIrelandIsraelItalyJamaicaJapanJordanKazakhstanKenyaKiribatiKorea, Rep.KosovoKuwaitKyrgyz RepublicLao PDRLate-demographic dividendLatin America & Caribbean Latin America & Caribbean (excluding high income)Latin America & the Caribbean (IDA & IBRD countries)LatviaLeast developed countries: UN classificationLebanonLesothoLiberiaLibyaLithuaniaLow & middle incomeLow incomeLower middle incomeLuxembourgMacao SAR, ChinaMacedonia, FYRMadagascarMalawiMalaysiaMaliMaltaMarshall IslandsMauritaniaMauritiusMexicoMicronesia, Fed. Sts.Middle East & North AfricaMiddle East & North Africa (excluding high income)Middle East & North Africa (IDA & IBRD countries)Middle incomeMoldovaMongoliaMontenegroMoroccoMozambiqueNamibiaNauruNetherlandsNew ZealandNicaraguaNigerNigeriaNorth AmericaNorwayOECD membersOmanOther small statesPacific island small statesPakistanPalauPanamaPapua New GuineaParaguayPeruPhilippinesPolandPortugalPost-demographic dividendPre-demographic dividendQatarRomaniaRussian FederationRwandaSamoaSao Tome and PrincipeSaudi ArabiaSenegalSerbiaSeychellesSierra LeoneSingaporeSlovak RepublicSloveniaSmall statesSolomon IslandsSouth AfricaSouth AsiaSouth Asia (IDA & IBRD)SpainSri LankaSt. Kitts and NevisSt. LuciaSt. Vincent and the GrenadinesSub-Saharan Africa Sub-Saharan Africa (excluding high income)Sub-Saharan Africa (IDA & IBRD countries)SurinameSwazilandSwedenSwitzerlandSyrian Arab RepublicTajikistanTanzaniaThailandTimor-LesteTogoTongaTrinidad and TobagoTunisiaTurkeyUgandaUkraineUnited Arab EmiratesUnited KingdomUnited StatesUpper middle incomeUruguayVanuatuVenezuela, RBVietnamWest Bank and GazaWorldYemen, Rep.ZambiaZimbabwe Linha do tempo:
Nesta escala de tempo está apresentado um gráfico de 1980 ano até 2016 ano Mexico. Dados de 1979 ano ausente. O número de observações reais por data: 37.
Fonte (nome):
Indicadores de desenvolvimento mundial
Fonte (organização):
International Monetary Fund, International Financial Statistics and Balance of Payments databases, World Bank, International Debt Statistics, and World Bank and OECD GDP estimates.
Categorias:
Economy & Growth, Financial Sector
Foi atualizado:
23 abr 2017 ano
Indicadores de alterações dos valores ao longo dos anos
Mínimo:
-0.076
1 jan 1996 ano
Máximo:
1.894
1 jan 2013 ano
Na data de observação
Valor
Mudança absoluta
A alteração em relação ao valor anterior
1 jan 1980 ano
0.002
+0.002
0.0%
1 jan 1981 ano
0.002
0.0
-12.19%
1 jan 1982 ano
0.012
+0.011
628.01%
1 jan 1983 ano
0.055
+0.043
345.31%
1 jan 1984 ano
-0.025
-0.08
-145.37%
1 jan 1985 ano
0.035
+0.06
-240.37%
1 jan 1986 ano
0.12
+0.085
243.48%
1 jan 1987 ano
0.248
+0.128
106.43%
1 jan 1988 ano
-0.023
-0.272
-109.4%
1 jan 1989 ano
0.021
+0.044
-189.51%
1 jan 1990 ano
0.052
+0.032
150.96%
1 jan 1991 ano
0.085
+0.033
62.03%
1 jan 1992 ano
0.056
-0.029
-33.79%
1 jan 1993 ano
0.178
+0.122
216.28%
1 jan 1994 ano
-0.022
-0.2
-112.27%
1 jan 1995 ano
0.201
+0.222
-1.02 mil%
1 jan 1996 ano
-0.076
-0.277
-138.13%
1 jan 1997 ano
0.01
+0.086
-112.5%
1 jan 1998 ano
0.231
+0.221
2.31 mil%
1 jan 1999 ano
0.272
+0.041
17.76%
1 jan 2000 ano
0.328
+0.056
20.8%
1 jan 2001 ano
0.053
-0.275
-83.81%
1 jan 2002 ano
0.608
+0.555
1.04 mil%
1 jan 2003 ano
0.12
-0.488
-80.23%
1 jan 2004 ano
0.176
+0.056
46.29%
1 jan 2005 ano
0.575
+0.4
227.42%
1 jan 2006 ano
0.747
+0.172
29.88%
1 jan 2007 ano
0.597
-0.151
-20.17%
1 jan 2008 ano
0.791
+0.195
32.63%
1 jan 2009 ano
0.105
-0.686
-86.72%
1 jan 2010 ano
1.073
+0.968
921.29%
1 jan 2011 ano
1.432
+0.359
33.42%
1 jan 2012 ano
1.079
-0.353
-24.64%
1 jan 2013 ano
1.894
+0.815
75.51%
1 jan 2014 ano
1.041
-0.853
-45.02%
1 jan 2015 ano
0.575
-0.466
-44.78%
1 jan 2016 ano
1.06
+0.485
84.42%
Classificação de países por estatísticas atuais por anos


Comentários: