29
/pt/
pt
AIzaSyAYiBZKx7MnpbEhh9jyipgxe19OcubqV5w
April 1, 2024
135508
Gabon
GAB
true
2
1
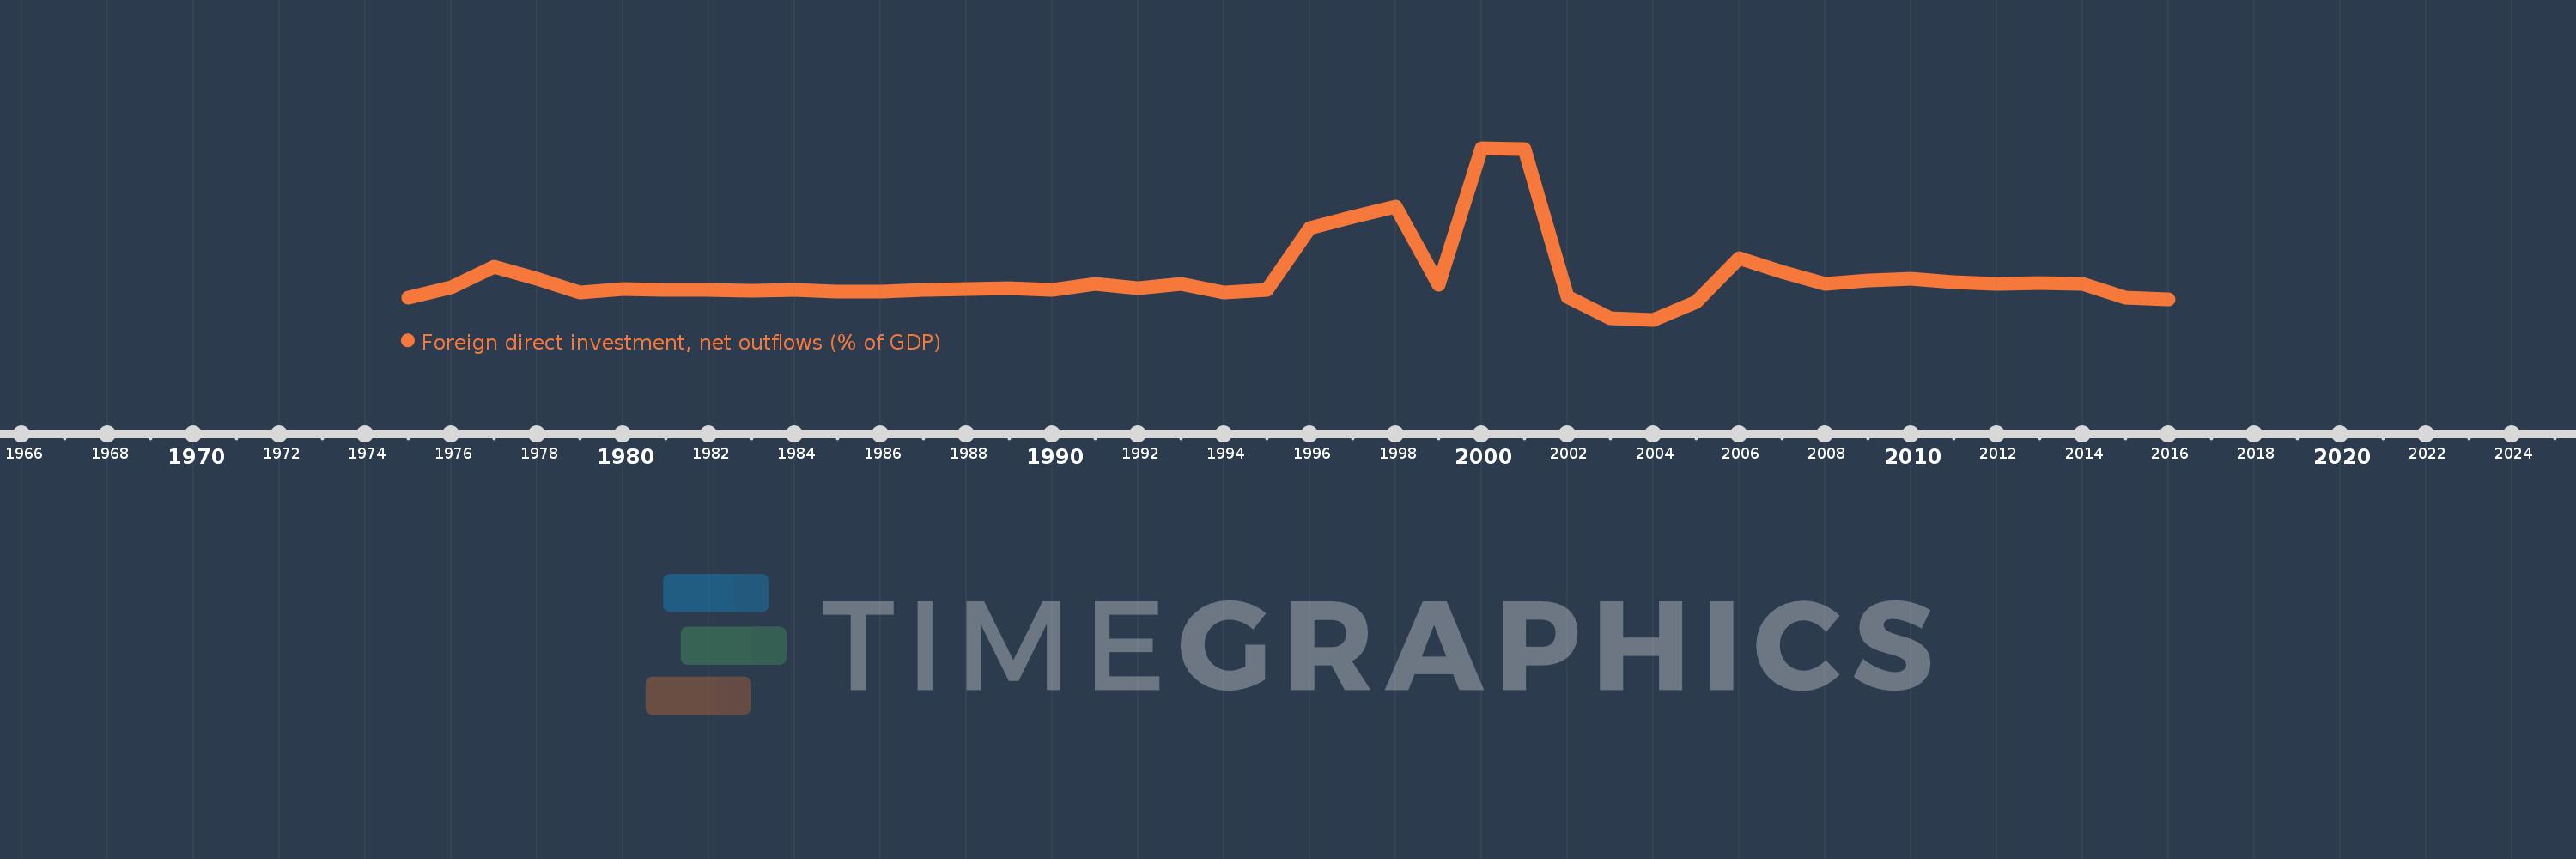
Foreign direct investment, net outflows (% of GDP)
2016,2015,2014,2013,2012,2011,2010,2009,2008,2007,2006,2005,2004,2003,2002,2001,2000,1999,1998,1997,1996,1995,1994,1993,1992,1991,1990,1989,1988,1987,1986,1985,1984,1983,1982,1981,1980,1979,1978,1977,1976,1975
Estas estatísticas em outros países:
AfghanistanAlbaniaAlgeriaAngolaAntigua and BarbudaArab WorldArgentinaArmeniaArubaAustraliaAustriaAzerbaijanBahamas, TheBahrainBangladeshBarbadosBelarusBelgiumBelizeBeninBermudaBoliviaBosnia and HerzegovinaBotswanaBrazilBrunei DarussalamBulgariaBurkina FasoBurundiCabo VerdeCambodiaCameroonCanadaCaribbean small statesCayman IslandsCentral African RepublicCentral Europe and the BalticsChadChileChinaColombiaComorosCongo, Dem. Rep.Congo, Rep.Costa RicaCote d'IvoireCroatiaCyprusCzech RepublicDenmarkDominicaDominican RepublicEarly-demographic dividendEast Asia & PacificEast Asia & Pacific (excluding high income)East Asia & Pacific (IDA & IBRD countries)EcuadorEgypt, Arab Rep.El SalvadorEquatorial GuineaEritreaEstoniaEuro areaEurope & Central AsiaEurope & Central Asia (excluding high income)Europe & Central Asia (IDA & IBRD countries)European UnionFijiFinlandFragile and conflict affected situationsFranceFrench PolynesiaGabonGambia, TheGeorgiaGermanyGhanaGreeceGrenadaGuatemalaGuineaGuinea-BissauGuyanaHaitiHeavily indebted poor countries (HIPC)High incomeHondurasHong Kong SAR, ChinaHungaryIBRD onlyIcelandIDA & IBRD totalIDA blendIDA onlyIDA totalIndiaIndonesiaIran, Islamic Rep.IraqIrelandIsraelItalyJamaicaJapanJordanKazakhstanKenyaKiribatiKorea, Rep.KosovoKuwaitKyrgyz RepublicLao PDRLate-demographic dividendLatin America & Caribbean Latin America & Caribbean (excluding high income)Latin America & the Caribbean (IDA & IBRD countries)LatviaLeast developed countries: UN classificationLebanonLesothoLiberiaLibyaLithuaniaLow & middle incomeLow incomeLower middle incomeLuxembourgMacao SAR, ChinaMacedonia, FYRMadagascarMalawiMalaysiaMaliMaltaMarshall IslandsMauritaniaMauritiusMexicoMicronesia, Fed. Sts.Middle East & North AfricaMiddle East & North Africa (excluding high income)Middle East & North Africa (IDA & IBRD countries)Middle incomeMoldovaMongoliaMontenegroMoroccoMozambiqueNamibiaNauruNetherlandsNew ZealandNicaraguaNigerNigeriaNorth AmericaNorwayOECD membersOmanOther small statesPacific island small statesPakistanPalauPanamaPapua New GuineaParaguayPeruPhilippinesPolandPortugalPost-demographic dividendPre-demographic dividendQatarRomaniaRussian FederationRwandaSamoaSao Tome and PrincipeSaudi ArabiaSenegalSerbiaSeychellesSierra LeoneSingaporeSlovak RepublicSloveniaSmall statesSolomon IslandsSouth AfricaSouth AsiaSouth Asia (IDA & IBRD)SpainSri LankaSt. Kitts and NevisSt. LuciaSt. Vincent and the GrenadinesSub-Saharan Africa Sub-Saharan Africa (excluding high income)Sub-Saharan Africa (IDA & IBRD countries)SurinameSwazilandSwedenSwitzerlandSyrian Arab RepublicTajikistanTanzaniaThailandTimor-LesteTogoTongaTrinidad and TobagoTunisiaTurkeyUgandaUkraineUnited Arab EmiratesUnited KingdomUnited StatesUpper middle incomeUruguayVanuatuVenezuela, RBVietnamWest Bank and GazaWorldYemen, Rep.ZambiaZimbabwe Linha do tempo:
Nesta escala de tempo está apresentado um gráfico de 1975 ano até 2016 ano Gabon. Dados de 1974 ano ausente. O número de observações reais por data: 42.
Fonte (nome):
Indicadores de desenvolvimento mundial
Fonte (organização):
International Monetary Fund, International Financial Statistics and Balance of Payments databases, World Bank, International Debt Statistics, and World Bank and OECD GDP estimates.
Categorias:
Economy & Growth, Financial Sector
Foi atualizado:
23 abr 2017 ano
Indicadores de alterações dos valores ao longo dos anos
Mínimo:
-1.219
1 jan 2004 ano
Máximo:
6.862
1 jan 2000 ano
Na data de observação
Valor
Mudança absoluta
A alteração em relação ao valor anterior
1 jan 1975 ano
-0.194
-0.194
0.0%
1 jan 1976 ano
0.324
+0.519
-267.0%
1 jan 1977 ano
1.263
+0.938
289.2%
1 jan 1978 ano
0.712
-0.551
-43.62%
1 jan 1979 ano
0.042
-0.67
-94.12%
1 jan 1980 ano
0.222
+0.18
430.08%
1 jan 1981 ano
0.187
-0.035
-15.75%
1 jan 1982 ano
0.184
-0.003
-1.61%
1 jan 1983 ano
0.133
-0.051
-27.73%
1 jan 1984 ano
0.169
+0.036
26.94%
1 jan 1985 ano
0.094
-0.074
-44.0%
1 jan 1986 ano
0.121
+0.027
28.41%
1 jan 1987 ano
0.193
+0.072
59.48%
1 jan 1988 ano
0.234
+0.041
21.08%
1 jan 1989 ano
0.254
+0.02
8.42%
1 jan 1990 ano
0.192
-0.062
-24.51%
1 jan 1991 ano
0.484
+0.292
152.37%
1 jan 1992 ano
0.276
-0.208
-43.04%
1 jan 1993 ano
0.459
+0.184
66.71%
1 jan 1994 ano
0.056
-0.403
-87.71%
1 jan 1995 ano
0.163
+0.107
189.27%
1 jan 1996 ano
3.107
+2.944
1.8 mil%
1 jan 1997 ano
3.623
+0.516
16.6%
1 jan 1998 ano
4.084
+0.461
12.73%
1 jan 1999 ano
0.428
-3.656
-89.53%
1 jan 2000 ano
6.862
+6.434
1.5 mil%
1 jan 2001 ano
6.828
-0.034
-0.49%
1 jan 2002 ano
-0.155
-6.982
-102.27%
1 jan 2003 ano
-1.146
-0.991
640.02%
1 jan 2004 ano
-1.219
-0.074
6.42%
1 jan 2005 ano
-0.391
+0.828
-67.95%
1 jan 2006 ano
1.683
+2.074
-530.8%
1 jan 2007 ano
1.045
-0.638
-37.91%
1 jan 2008 ano
0.472
-0.573
-54.8%
1 jan 2009 ano
0.619
+0.147
31.08%
1 jan 2010 ano
0.721
+0.102
16.42%
1 jan 2011 ano
0.561
-0.16
-22.14%
1 jan 2012 ano
0.483
-0.078
-13.92%
1 jan 2013 ano
0.496
+0.013
2.63%
1 jan 2014 ano
0.481
-0.015
-3.08%
1 jan 2015 ano
-0.197
-0.677
-140.95%
1 jan 2016 ano
-0.26
-0.064
32.36%
Classificação de países por estatísticas atuais por anos


Comentários: