29
/pt/
pt
AIzaSyAYiBZKx7MnpbEhh9jyipgxe19OcubqV5w
April 1, 2024
240437
Singapore
SGP
true
2
1
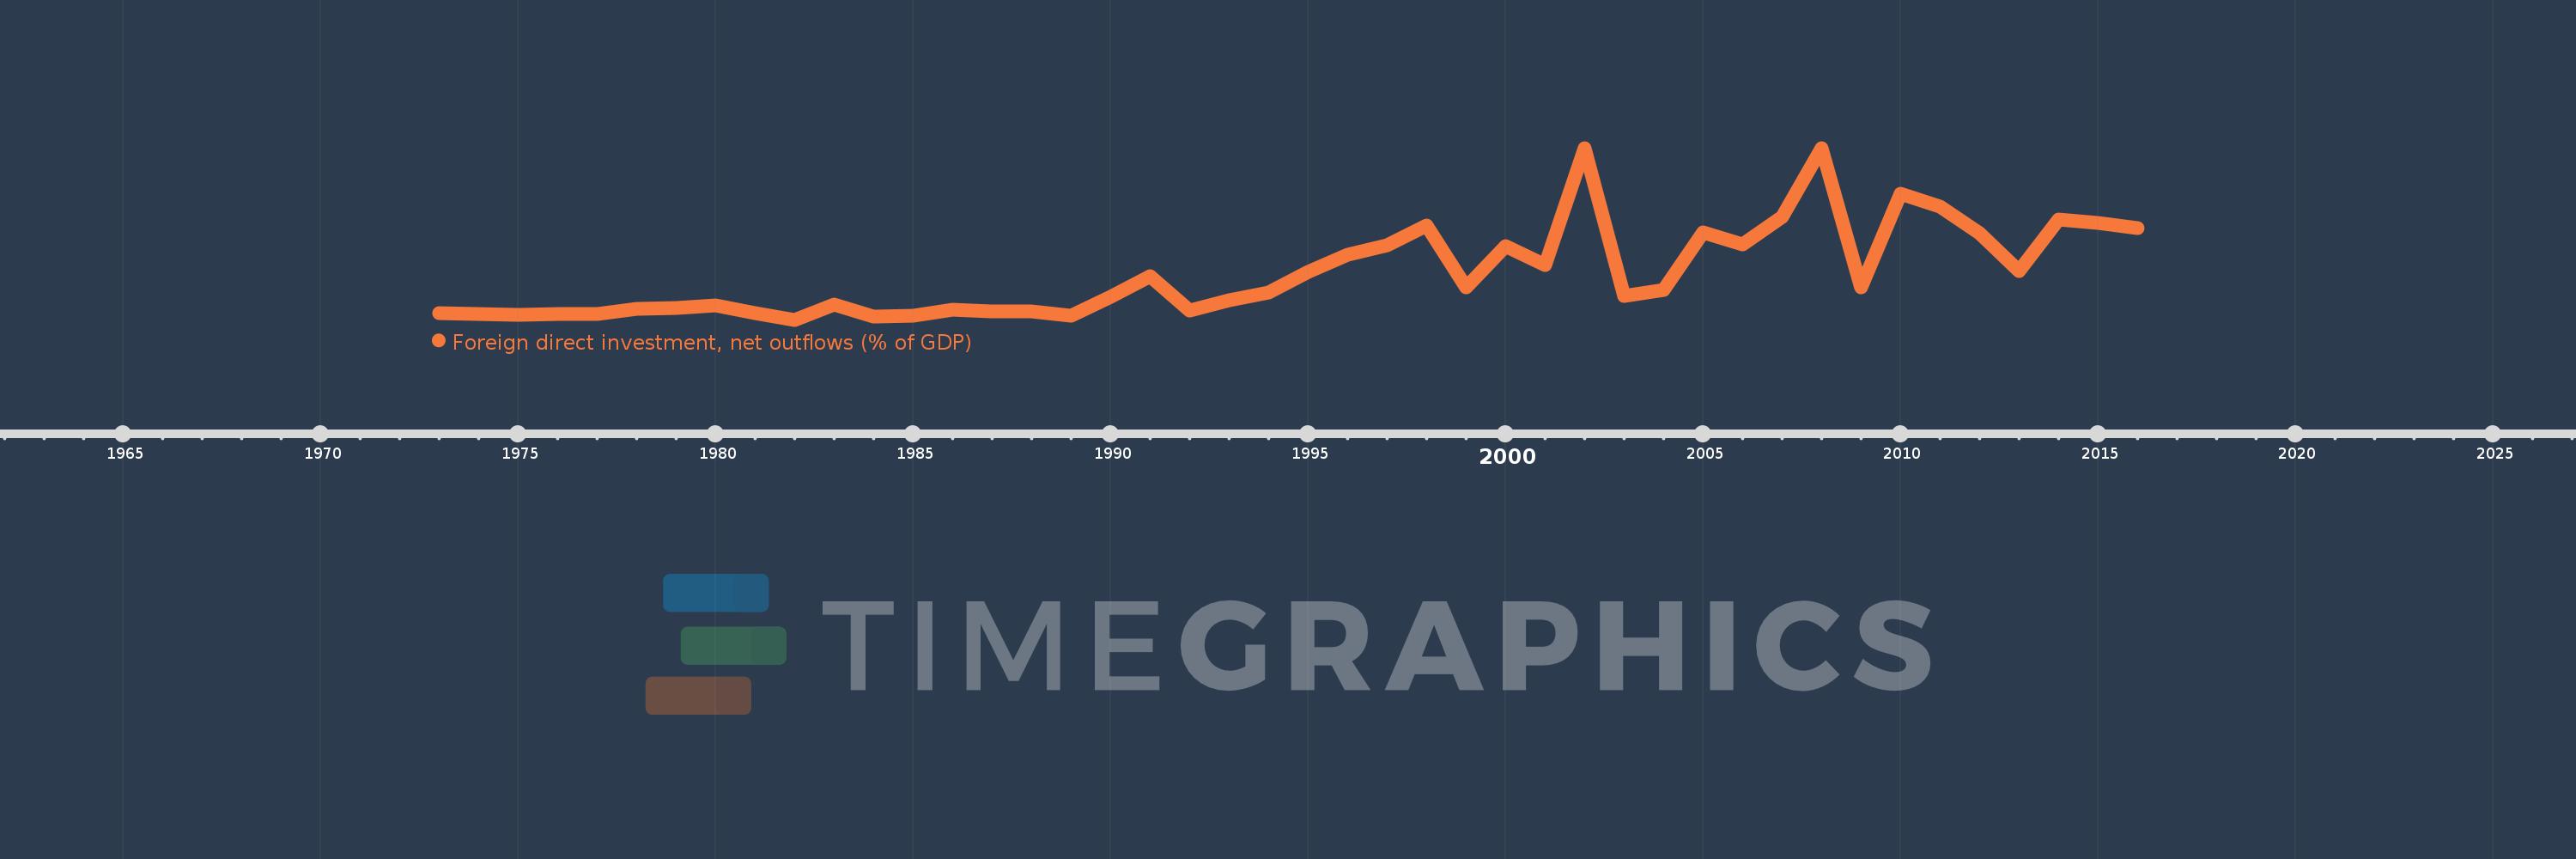
Foreign direct investment, net outflows (% of GDP)
2016,2015,2014,2013,2012,2011,2010,2009,2008,2007,2006,2005,2004,2003,2002,2001,2000,1999,1998,1997,1996,1995,1994,1993,1992,1991,1990,1989,1988,1987,1986,1985,1984,1983,1982,1981,1980,1979,1978,1977,1976,1975,1974,1973
Estas estatísticas em outros países:
AfghanistanAlbaniaAlgeriaAngolaAntigua and BarbudaArab WorldArgentinaArmeniaArubaAustraliaAustriaAzerbaijanBahamas, TheBahrainBangladeshBarbadosBelarusBelgiumBelizeBeninBermudaBoliviaBosnia and HerzegovinaBotswanaBrazilBrunei DarussalamBulgariaBurkina FasoBurundiCabo VerdeCambodiaCameroonCanadaCaribbean small statesCayman IslandsCentral African RepublicCentral Europe and the BalticsChadChileChinaColombiaComorosCongo, Dem. Rep.Congo, Rep.Costa RicaCote d'IvoireCroatiaCyprusCzech RepublicDenmarkDominicaDominican RepublicEarly-demographic dividendEast Asia & PacificEast Asia & Pacific (excluding high income)East Asia & Pacific (IDA & IBRD countries)EcuadorEgypt, Arab Rep.El SalvadorEquatorial GuineaEritreaEstoniaEuro areaEurope & Central AsiaEurope & Central Asia (excluding high income)Europe & Central Asia (IDA & IBRD countries)European UnionFijiFinlandFragile and conflict affected situationsFranceFrench PolynesiaGabonGambia, TheGeorgiaGermanyGhanaGreeceGrenadaGuatemalaGuineaGuinea-BissauGuyanaHaitiHeavily indebted poor countries (HIPC)High incomeHondurasHong Kong SAR, ChinaHungaryIBRD onlyIcelandIDA & IBRD totalIDA blendIDA onlyIDA totalIndiaIndonesiaIran, Islamic Rep.IraqIrelandIsraelItalyJamaicaJapanJordanKazakhstanKenyaKiribatiKorea, Rep.KosovoKuwaitKyrgyz RepublicLao PDRLate-demographic dividendLatin America & Caribbean Latin America & Caribbean (excluding high income)Latin America & the Caribbean (IDA & IBRD countries)LatviaLeast developed countries: UN classificationLebanonLesothoLiberiaLibyaLithuaniaLow & middle incomeLow incomeLower middle incomeLuxembourgMacao SAR, ChinaMacedonia, FYRMadagascarMalawiMalaysiaMaliMaltaMarshall IslandsMauritaniaMauritiusMexicoMicronesia, Fed. Sts.Middle East & North AfricaMiddle East & North Africa (excluding high income)Middle East & North Africa (IDA & IBRD countries)Middle incomeMoldovaMongoliaMontenegroMoroccoMozambiqueNamibiaNauruNetherlandsNew ZealandNicaraguaNigerNigeriaNorth AmericaNorwayOECD membersOmanOther small statesPacific island small statesPakistanPalauPanamaPapua New GuineaParaguayPeruPhilippinesPolandPortugalPost-demographic dividendPre-demographic dividendQatarRomaniaRussian FederationRwandaSamoaSao Tome and PrincipeSaudi ArabiaSenegalSerbiaSeychellesSierra LeoneSingaporeSlovak RepublicSloveniaSmall statesSolomon IslandsSouth AfricaSouth AsiaSouth Asia (IDA & IBRD)SpainSri LankaSt. Kitts and NevisSt. LuciaSt. Vincent and the GrenadinesSub-Saharan Africa Sub-Saharan Africa (excluding high income)Sub-Saharan Africa (IDA & IBRD countries)SurinameSwazilandSwedenSwitzerlandSyrian Arab RepublicTajikistanTanzaniaThailandTimor-LesteTogoTongaTrinidad and TobagoTunisiaTurkeyUgandaUkraineUnited Arab EmiratesUnited KingdomUnited StatesUpper middle incomeUruguayVanuatuVenezuela, RBVietnamWest Bank and GazaWorldYemen, Rep.ZambiaZimbabwe Linha do tempo:
Nesta escala de tempo está apresentado um gráfico de 1973 ano até 2016 ano Singapore. Dados de 1972 ano ausente. O número de observações reais por data: 44.
Fonte (nome):
Indicadores de desenvolvimento mundial
Fonte (organização):
International Monetary Fund, International Financial Statistics and Balance of Payments databases, World Bank, International Debt Statistics, and World Bank and OECD GDP estimates.
Categorias:
Economy & Growth, Financial Sector
Foi atualizado:
23 abr 2017 ano
Indicadores de alterações dos valores ao longo dos anos
Mínimo:
-0.104
1 jan 1982 ano
Máximo:
22.715
1 jan 2008 ano
Na data de observação
Valor
Mudança absoluta
A alteração em relação ao valor anterior
1 jan 1973 ano
0.745
+0.745
0.0%
1 jan 1974 ano
0.705
-0.04
-5.37%
1 jan 1975 ano
0.574
-0.131
-18.56%
1 jan 1976 ano
0.674
+0.099
17.33%
1 jan 1977 ano
0.71
+0.036
5.4%
1 jan 1978 ano
1.288
+0.578
81.45%
1 jan 1979 ano
1.51
+0.221
17.16%
1 jan 1980 ano
1.801
+0.291
19.3%
1 jan 1981 ano
0.821
-0.98
-54.43%
1 jan 1982 ano
-0.104
-0.924
-112.62%
1 jan 1983 ano
1.892
+1.995
-1.93 mil%
1 jan 1984 ano
0.277
-1.615
-85.36%
1 jan 1985 ano
0.468
+0.191
69.0%
1 jan 1986 ano
1.242
+0.774
165.43%
1 jan 1987 ano
0.977
-0.265
-21.35%
1 jan 1988 ano
0.986
+0.009
0.94%
1 jan 1989 ano
0.465
-0.521
-52.87%
1 jan 1990 ano
2.9
+2.435
523.85%
1 jan 1991 ano
5.626
+2.726
94.01%
1 jan 1992 ano
1.156
-4.469
-79.45%
1 jan 1993 ano
2.525
+1.369
118.37%
1 jan 1994 ano
3.548
+1.023
40.53%
1 jan 1995 ano
6.204
+2.655
74.84%
1 jan 1996 ano
8.51
+2.306
37.17%
1 jan 1997 ano
9.755
+1.245
14.63%
1 jan 1998 ano
12.403
+2.648
27.14%
1 jan 1999 ano
4.225
-8.178
-65.93%
1 jan 2000 ano
9.631
+5.406
127.95%
1 jan 2001 ano
7.146
-2.485
-25.8%
1 jan 2002 ano
22.629
+15.483
216.66%
1 jan 2003 ano
3.084
-19.545
-86.37%
1 jan 2004 ano
3.841
+0.757
24.55%
1 jan 2005 ano
11.506
+7.665
199.57%
1 jan 2006 ano
9.851
-1.655
-14.38%
1 jan 2007 ano
13.575
+3.723
37.79%
1 jan 2008 ano
22.715
+9.14
67.33%
1 jan 2009 ano
4.143
-18.571
-81.76%
1 jan 2010 ano
16.652
+12.509
301.9%
1 jan 2011 ano
14.976
-1.676
-10.06%
1 jan 2012 ano
11.431
-3.546
-23.68%
1 jan 2013 ano
6.34
-5.09
-44.53%
1 jan 2014 ano
13.185
+6.844
107.95%
1 jan 2015 ano
12.774
-0.411
-3.12%
1 jan 2016 ano
12.122
-0.652
-5.1%
Classificação de países por estatísticas atuais por anos


Comentários: