29
/pt/
pt
AIzaSyAYiBZKx7MnpbEhh9jyipgxe19OcubqV5w
April 1, 2024
167476
Kenya
KEN
true
2
1
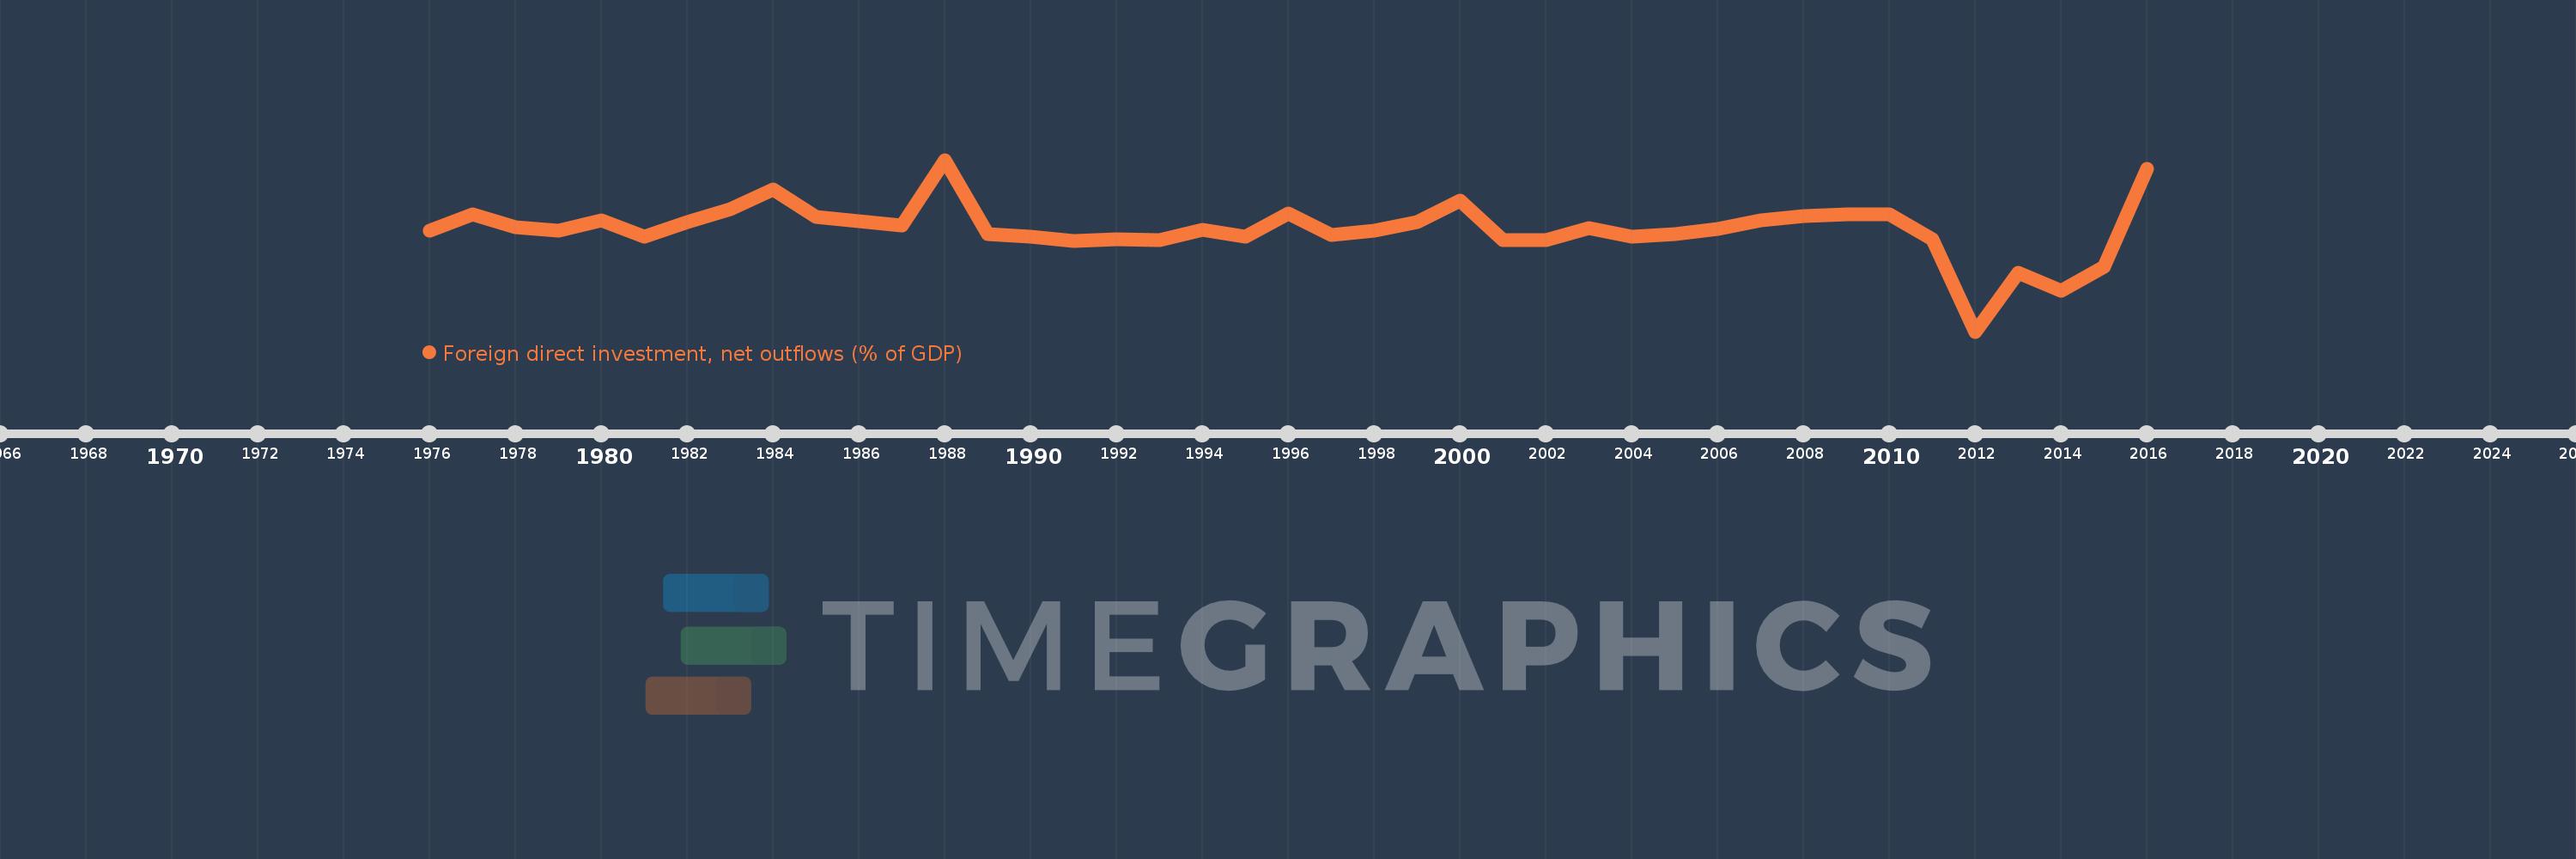
Foreign direct investment, net outflows (% of GDP)
2016,2015,2014,2013,2012,2011,2010,2009,2008,2007,2006,2005,2004,2003,2002,2001,2000,1999,1998,1997,1996,1995,1994,1993,1992,1991,1990,1989,1988,1987,1986,1985,1984,1983,1982,1981,1980,1979,1978,1977,1976
Estas estatísticas em outros países:
AfghanistanAlbaniaAlgeriaAngolaAntigua and BarbudaArab WorldArgentinaArmeniaArubaAustraliaAustriaAzerbaijanBahamas, TheBahrainBangladeshBarbadosBelarusBelgiumBelizeBeninBermudaBoliviaBosnia and HerzegovinaBotswanaBrazilBrunei DarussalamBulgariaBurkina FasoBurundiCabo VerdeCambodiaCameroonCanadaCaribbean small statesCayman IslandsCentral African RepublicCentral Europe and the BalticsChadChileChinaColombiaComorosCongo, Dem. Rep.Congo, Rep.Costa RicaCote d'IvoireCroatiaCyprusCzech RepublicDenmarkDominicaDominican RepublicEarly-demographic dividendEast Asia & PacificEast Asia & Pacific (excluding high income)East Asia & Pacific (IDA & IBRD countries)EcuadorEgypt, Arab Rep.El SalvadorEquatorial GuineaEritreaEstoniaEuro areaEurope & Central AsiaEurope & Central Asia (excluding high income)Europe & Central Asia (IDA & IBRD countries)European UnionFijiFinlandFragile and conflict affected situationsFranceFrench PolynesiaGabonGambia, TheGeorgiaGermanyGhanaGreeceGrenadaGuatemalaGuineaGuinea-BissauGuyanaHaitiHeavily indebted poor countries (HIPC)High incomeHondurasHong Kong SAR, ChinaHungaryIBRD onlyIcelandIDA & IBRD totalIDA blendIDA onlyIDA totalIndiaIndonesiaIran, Islamic Rep.IraqIrelandIsraelItalyJamaicaJapanJordanKazakhstanKenyaKiribatiKorea, Rep.KosovoKuwaitKyrgyz RepublicLao PDRLate-demographic dividendLatin America & Caribbean Latin America & Caribbean (excluding high income)Latin America & the Caribbean (IDA & IBRD countries)LatviaLeast developed countries: UN classificationLebanonLesothoLiberiaLibyaLithuaniaLow & middle incomeLow incomeLower middle incomeLuxembourgMacao SAR, ChinaMacedonia, FYRMadagascarMalawiMalaysiaMaliMaltaMarshall IslandsMauritaniaMauritiusMexicoMicronesia, Fed. Sts.Middle East & North AfricaMiddle East & North Africa (excluding high income)Middle East & North Africa (IDA & IBRD countries)Middle incomeMoldovaMongoliaMontenegroMoroccoMozambiqueNamibiaNauruNetherlandsNew ZealandNicaraguaNigerNigeriaNorth AmericaNorwayOECD membersOmanOther small statesPacific island small statesPakistanPalauPanamaPapua New GuineaParaguayPeruPhilippinesPolandPortugalPost-demographic dividendPre-demographic dividendQatarRomaniaRussian FederationRwandaSamoaSao Tome and PrincipeSaudi ArabiaSenegalSerbiaSeychellesSierra LeoneSingaporeSlovak RepublicSloveniaSmall statesSolomon IslandsSouth AfricaSouth AsiaSouth Asia (IDA & IBRD)SpainSri LankaSt. Kitts and NevisSt. LuciaSt. Vincent and the GrenadinesSub-Saharan Africa Sub-Saharan Africa (excluding high income)Sub-Saharan Africa (IDA & IBRD countries)SurinameSwazilandSwedenSwitzerlandSyrian Arab RepublicTajikistanTanzaniaThailandTimor-LesteTogoTongaTrinidad and TobagoTunisiaTurkeyUgandaUkraineUnited Arab EmiratesUnited KingdomUnited StatesUpper middle incomeUruguayVanuatuVenezuela, RBVietnamWest Bank and GazaWorldYemen, Rep.ZambiaZimbabwe Linha do tempo:
Nesta escala de tempo está apresentado um gráfico de 1976 ano até 2016 ano Kenya. Dados de 1975 ano ausente. O número de observações reais por data: 41.
Fonte (nome):
Indicadores de desenvolvimento mundial
Fonte (organização):
International Monetary Fund, International Financial Statistics and Balance of Payments databases, World Bank, International Debt Statistics, and World Bank and OECD GDP estimates.
Categorias:
Economy & Growth, Financial Sector
Foi atualizado:
23 abr 2017 ano
Indicadores de alterações dos valores ao longo dos anos
Mínimo:
-0.443
1 jan 2012 ano
Máximo:
0.386
1 jan 1988 ano
Na data de observação
Valor
Mudança absoluta
A alteração em relação ao valor anterior
1 jan 1976 ano
0.042
+0.042
0.0%
1 jan 1977 ano
0.124
+0.082
196.38%
1 jan 1978 ano
0.059
-0.065
-52.24%
1 jan 1979 ano
0.044
-0.015
-25.76%
1 jan 1980 ano
0.094
+0.051
115.02%
1 jan 1981 ano
0.015
-0.08
-84.28%
1 jan 1982 ano
0.085
+0.071
475.91%
1 jan 1983 ano
0.149
+0.064
74.9%
1 jan 1984 ano
0.242
+0.093
62.23%
1 jan 1985 ano
0.111
-0.132
-54.25%
1 jan 1986 ano
0.088
-0.023
-20.42%
1 jan 1987 ano
0.068
-0.02
-22.85%
1 jan 1988 ano
0.386
+0.318
466.45%
1 jan 1989 ano
0.026
-0.359
-93.18%
1 jan 1990 ano
0.016
-0.01
-37.52%
1 jan 1991 ano
-0.005
-0.022
-131.43%
1 jan 1992 ano
0.002
+0.008
-147.52%
1 jan 1993 ano
-0.001
-0.004
-147.16%
1 jan 1994 ano
0.048
+0.05
-4.29 mil%
1 jan 1995 ano
0.013
-0.035
-72.17%
1 jan 1996 ano
0.126
+0.112
830.37%
1 jan 1997 ano
0.023
-0.103
-81.75%
1 jan 1998 ano
0.045
+0.022
98.16%
1 jan 1999 ano
0.086
+0.041
89.53%
1 jan 2000 ano
0.19
+0.104
121.4%
1 jan 2001 ano
0.0
-0.19
-99.96%
1 jan 2002 ano
0.0
0.0
-2.16%
1 jan 2003 ano
0.056
+0.056
73.15 mil%
1 jan 2004 ano
0.014
-0.042
-75.31%
1 jan 2005 ano
0.027
+0.014
97.05%
1 jan 2006 ano
0.052
+0.024
88.43%
1 jan 2007 ano
0.093
+0.041
79.44%
1 jan 2008 ano
0.113
+0.02
21.54%
1 jan 2009 ano
0.122
+0.009
8.14%
1 jan 2010 ano
0.124
+0.002
1.88%
1 jan 2011 ano
0.004
-0.12
-96.82%
1 jan 2012 ano
-0.443
-0.447
-11.34 mil%
1 jan 2013 ano
-0.157
+0.286
-64.58%
1 jan 2014 ano
-0.248
-0.091
58.28%
1 jan 2015 ano
-0.128
+0.121
-48.55%
1 jan 2016 ano
0.342
+0.47
-367.75%
Classificação de países por estatísticas atuais por anos


Comentários: