29
/pt/
pt
AIzaSyAYiBZKx7MnpbEhh9jyipgxe19OcubqV5w
April 1, 2024
52812
OECD members
OED
false
2
1
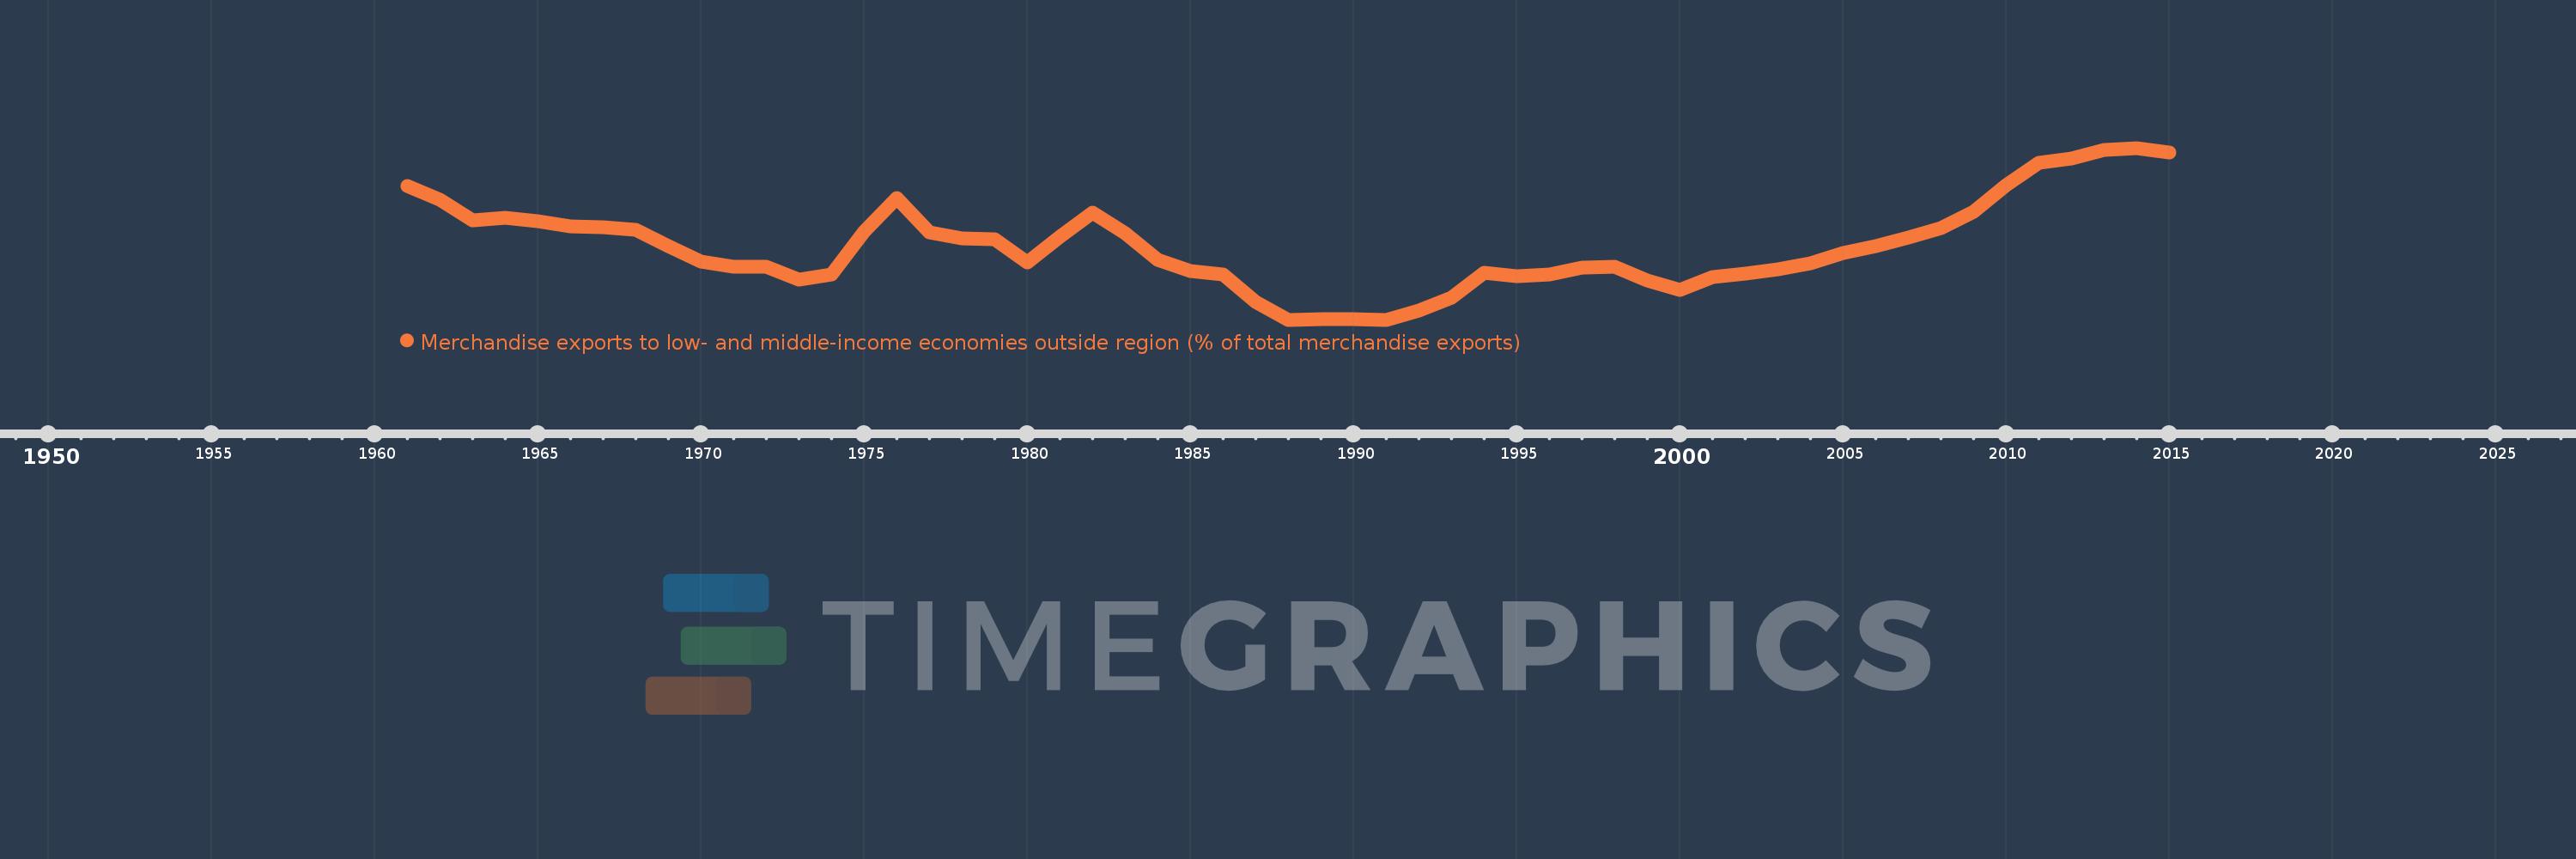
Merchandise exports to low- and middle-income economies outside region (% of total merchandise exports)
2015,2014,2013,2012,2011,2010,2009,2008,2007,2006,2005,2004,2003,2002,2001,2000,1999,1998,1997,1996,1995,1994,1993,1992,1991,1990,1989,1988,1987,1986,1985,1984,1983,1982,1981,1980,1979,1978,1977,1976,1975,1974,1973,1972,1971,1970,1969,1968,1967,1966,1965,1964,1963,1962,1961
Estas estatísticas em outros países:
AfghanistanAlbaniaAlgeriaAngolaArab WorldArgentinaArmeniaArubaAustraliaAustriaAzerbaijanBahamas, TheBahrainBangladeshBarbadosBelarusBelgiumBelizeBeninBermudaBoliviaBrazilBrunei DarussalamBulgariaBurundiCabo VerdeCambodiaCameroonCanadaCaribbean small statesCentral African RepublicCentral Europe and the BalticsChileChinaColombiaCongo, Dem. Rep.Congo, Rep.Costa RicaCote d'IvoireCroatiaCubaCyprusCzech RepublicDenmarkDominicaDominican RepublicEarly-demographic dividendEast Asia & PacificEast Asia & Pacific (excluding high income)East Asia & Pacific (IDA & IBRD countries)EcuadorEgypt, Arab Rep.El SalvadorEstoniaEthiopiaEuro areaEurope & Central AsiaEurope & Central Asia (excluding high income)Europe & Central Asia (IDA & IBRD countries)European UnionFijiFinlandFragile and conflict affected situationsFranceGabonGambia, TheGeorgiaGermanyGhanaGreeceGreenlandGuatemalaGuineaGuyanaHaitiHeavily indebted poor countries (HIPC)High incomeHondurasHong Kong SAR, ChinaHungaryIBRD onlyIcelandIDA & IBRD totalIDA blendIDA onlyIDA totalIndiaIndonesiaIran, Islamic Rep.IraqIrelandIsraelItalyJamaicaJapanJordanKazakhstanKenyaKorea, Dem. People’s Rep.Korea, Rep.KuwaitLao PDRLate-demographic dividendLatin America & Caribbean Latin America & Caribbean (excluding high income)Latin America & the Caribbean (IDA & IBRD countries)LatviaLeast developed countries: UN classificationLebanonLiberiaLibyaLithuaniaLow & middle incomeLow incomeLower middle incomeLuxembourgMacao SAR, ChinaMacedonia, FYRMadagascarMalawiMalaysiaMaliMaltaMauritaniaMauritiusMexicoMiddle East & North AfricaMiddle East & North Africa (excluding high income)Middle East & North Africa (IDA & IBRD countries)Middle incomeMoldovaMongoliaMontenegroMoroccoMozambiqueMyanmarNetherlandsNew CaledoniaNew ZealandNicaraguaNigerNigeriaNorth AmericaNorwayOECD membersOmanOther small statesPacific island small statesPakistanPanamaPapua New GuineaParaguayPeruPhilippinesPolandPortugalPost-demographic dividendPre-demographic dividendQatarRomaniaRussian FederationRwandaSamoaSaudi ArabiaSenegalSerbiaSeychellesSierra LeoneSingaporeSlovak RepublicSloveniaSmall statesSomaliaSouth AfricaSouth AsiaSouth Asia (IDA & IBRD)SpainSri LankaSt. LuciaSt. Vincent and the GrenadinesSub-Saharan Africa Sub-Saharan Africa (excluding high income)Sub-Saharan Africa (IDA & IBRD countries)SudanSurinameSwedenSwitzerlandSyrian Arab RepublicTanzaniaThailandTogoTrinidad and TobagoTunisiaTurkeyUgandaUkraineUnited Arab EmiratesUnited KingdomUnited StatesUpper middle incomeUruguayVenezuela, RBVietnamWorldYemen, Rep.ZambiaZimbabwe Linha do tempo:
Nesta escala de tempo está apresentado um gráfico de 1961 ano até 2015 ano OECD members. Dados de 1960 ano ausente. O número de observações reais por data: 55.
Fonte (nome):
Indicadores de desenvolvimento mundial
Fonte (organização):
World Bank staff estimates based data from International Monetary Fund's Direction of Trade database.
Categorias:
Private Sector, Trade
Foi atualizado:
23 abr 2017 ano
Indicadores de alterações dos valores ao longo dos anos
Mínimo:
11.384
1 jan 1988 ano
Máximo:
22.681
1 jan 2014 ano
Na data de observação
Valor
Mudança absoluta
A alteração em relação ao valor anterior
1 jan 1961 ano
20.191
+20.191
0.0%
1 jan 1962 ano
19.271
-0.92
-4.56%
1 jan 1963 ano
17.94
-1.331
-6.91%
1 jan 1964 ano
18.083
+0.143
0.8%
1 jan 1965 ano
17.862
-0.221
-1.22%
1 jan 1966 ano
17.505
-0.357
-2.0%
1 jan 1967 ano
17.479
-0.026
-0.15%
1 jan 1968 ano
17.271
-0.207
-1.19%
1 jan 1969 ano
16.234
-1.037
-6.01%
1 jan 1970 ano
15.189
-1.045
-6.44%
1 jan 1971 ano
14.878
-0.311
-2.05%
1 jan 1972 ano
14.843
-0.034
-0.23%
1 jan 1973 ano
14.027
-0.816
-5.5%
1 jan 1974 ano
14.362
+0.335
2.38%
1 jan 1975 ano
17.158
+2.796
19.47%
1 jan 1976 ano
19.409
+2.251
13.12%
1 jan 1977 ano
17.107
-2.302
-11.86%
1 jan 1978 ano
16.754
-0.353
-2.06%
1 jan 1979 ano
16.701
-0.053
-0.31%
1 jan 1980 ano
15.157
-1.544
-9.25%
1 jan 1981 ano
16.829
+1.672
11.03%
1 jan 1982 ano
18.405
+1.576
9.37%
1 jan 1983 ano
17.057
-1.348
-7.33%
1 jan 1984 ano
15.314
-1.743
-10.22%
1 jan 1985 ano
14.602
-0.712
-4.65%
1 jan 1986 ano
14.357
-0.245
-1.68%
1 jan 1987 ano
12.54
-1.817
-12.66%
1 jan 1988 ano
11.384
-1.156
-9.22%
1 jan 1989 ano
11.399
+0.015
0.13%
1 jan 1990 ano
11.396
-0.003
-0.03%
1 jan 1991 ano
11.391
-0.005
-0.04%
1 jan 1992 ano
11.974
+0.583
5.12%
1 jan 1993 ano
12.849
+0.875
7.31%
1 jan 1994 ano
14.45
+1.601
12.46%
1 jan 1995 ano
14.236
-0.214
-1.48%
1 jan 1996 ano
14.364
+0.128
0.9%
1 jan 1997 ano
14.785
+0.421
2.93%
1 jan 1998 ano
14.856
+0.072
0.48%
1 jan 1999 ano
13.956
-0.901
-6.06%
1 jan 2000 ano
13.359
-0.597
-4.28%
1 jan 2001 ano
14.192
+0.833
6.24%
1 jan 2002 ano
14.426
+0.234
1.65%
1 jan 2003 ano
14.7
+0.275
1.9%
1 jan 2004 ano
15.108
+0.408
2.77%
1 jan 2005 ano
15.755
+0.647
4.29%
1 jan 2006 ano
16.242
+0.487
3.09%
1 jan 2007 ano
16.812
+0.57
3.51%
1 jan 2008 ano
17.398
+0.586
3.49%
1 jan 2009 ano
18.483
+1.085
6.24%
1 jan 2010 ano
20.209
+1.726
9.34%
1 jan 2011 ano
21.696
+1.487
7.36%
1 jan 2012 ano
21.964
+0.268
1.23%
1 jan 2013 ano
22.575
+0.611
2.78%
1 jan 2014 ano
22.681
+0.107
0.47%
1 jan 2015 ano
22.384
-0.297
-1.31%
Classificação de países por estatísticas atuais por anos


Comentários: