29
/pt/
pt
AIzaSyAYiBZKx7MnpbEhh9jyipgxe19OcubqV5w
April 1, 2024
171948
Kuwait
KWT
true
2
1
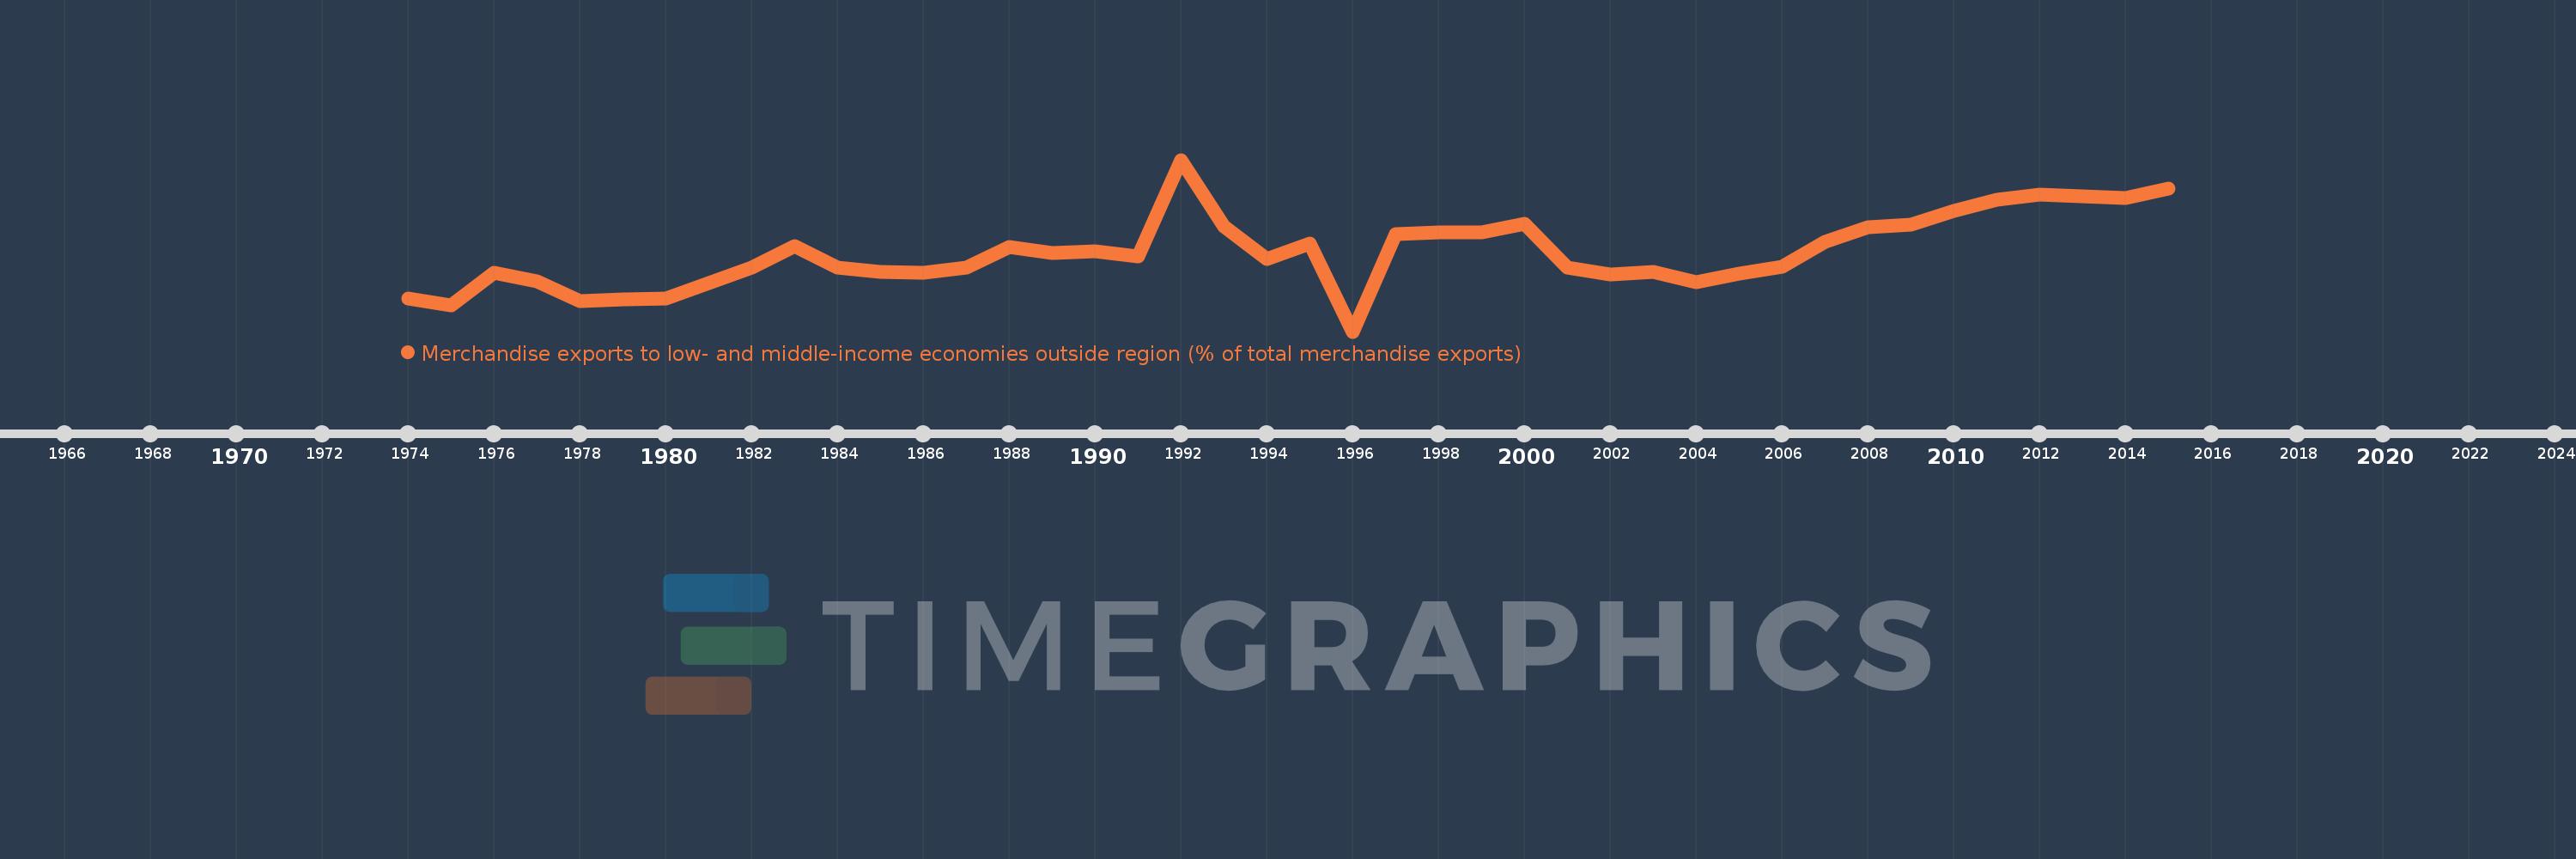
Merchandise exports to low- and middle-income economies outside region (% of total merchandise exports)
2015,2014,2013,2012,2011,2010,2009,2008,2007,2006,2005,2004,2003,2002,2001,2000,1999,1998,1997,1996,1995,1994,1993,1992,1991,1990,1989,1988,1987,1986,1985,1984,1983,1982,1981,1980,1979,1978,1977,1976,1975,1974
Estas estatísticas em outros países:
AfghanistanAlbaniaAlgeriaAngolaArab WorldArgentinaArmeniaArubaAustraliaAustriaAzerbaijanBahamas, TheBahrainBangladeshBarbadosBelarusBelgiumBelizeBeninBermudaBoliviaBrazilBrunei DarussalamBulgariaBurundiCabo VerdeCambodiaCameroonCanadaCaribbean small statesCentral African RepublicCentral Europe and the BalticsChileChinaColombiaCongo, Dem. Rep.Congo, Rep.Costa RicaCote d'IvoireCroatiaCubaCyprusCzech RepublicDenmarkDominicaDominican RepublicEarly-demographic dividendEast Asia & PacificEast Asia & Pacific (excluding high income)East Asia & Pacific (IDA & IBRD countries)EcuadorEgypt, Arab Rep.El SalvadorEstoniaEthiopiaEuro areaEurope & Central AsiaEurope & Central Asia (excluding high income)Europe & Central Asia (IDA & IBRD countries)European UnionFijiFinlandFragile and conflict affected situationsFranceGabonGambia, TheGeorgiaGermanyGhanaGreeceGreenlandGuatemalaGuineaGuyanaHaitiHeavily indebted poor countries (HIPC)High incomeHondurasHong Kong SAR, ChinaHungaryIBRD onlyIcelandIDA & IBRD totalIDA blendIDA onlyIDA totalIndiaIndonesiaIran, Islamic Rep.IraqIrelandIsraelItalyJamaicaJapanJordanKazakhstanKenyaKorea, Dem. People’s Rep.Korea, Rep.KuwaitLao PDRLate-demographic dividendLatin America & Caribbean Latin America & Caribbean (excluding high income)Latin America & the Caribbean (IDA & IBRD countries)LatviaLeast developed countries: UN classificationLebanonLiberiaLibyaLithuaniaLow & middle incomeLow incomeLower middle incomeLuxembourgMacao SAR, ChinaMacedonia, FYRMadagascarMalawiMalaysiaMaliMaltaMauritaniaMauritiusMexicoMiddle East & North AfricaMiddle East & North Africa (excluding high income)Middle East & North Africa (IDA & IBRD countries)Middle incomeMoldovaMongoliaMontenegroMoroccoMozambiqueMyanmarNetherlandsNew CaledoniaNew ZealandNicaraguaNigerNigeriaNorth AmericaNorwayOECD membersOmanOther small statesPacific island small statesPakistanPanamaPapua New GuineaParaguayPeruPhilippinesPolandPortugalPost-demographic dividendPre-demographic dividendQatarRomaniaRussian FederationRwandaSamoaSaudi ArabiaSenegalSerbiaSeychellesSierra LeoneSingaporeSlovak RepublicSloveniaSmall statesSomaliaSouth AfricaSouth AsiaSouth Asia (IDA & IBRD)SpainSri LankaSt. LuciaSt. Vincent and the GrenadinesSub-Saharan Africa Sub-Saharan Africa (excluding high income)Sub-Saharan Africa (IDA & IBRD countries)SudanSurinameSwedenSwitzerlandSyrian Arab RepublicTanzaniaThailandTogoTrinidad and TobagoTunisiaTurkeyUgandaUkraineUnited Arab EmiratesUnited KingdomUnited StatesUpper middle incomeUruguayVenezuela, RBVietnamWorldYemen, Rep.ZambiaZimbabwe Linha do tempo:
Nesta escala de tempo está apresentado um gráfico de 1974 ano até 2015 ano Kuwait. Dados de 1973 ano ausente. O número de observações reais por data: 42.
Fonte (nome):
Indicadores de desenvolvimento mundial
Fonte (organização):
World Bank staff estimates based data from International Monetary Fund's Direction of Trade database.
Categorias:
Private Sector, Trade
Foi atualizado:
23 abr 2017 ano
Indicadores de alterações dos valores ao longo dos anos
Mínimo:
2.866
1 jan 1996 ano
Máximo:
49.412
1 jan 1992 ano
Na data de observação
Valor
Mudança absoluta
A alteração em relação ao valor anterior
1 jan 1974 ano
11.819
+11.819
0.0%
1 jan 1975 ano
9.908
-1.911
-16.17%
1 jan 1976 ano
18.774
+8.866
89.48%
1 jan 1977 ano
16.416
-2.358
-12.56%
1 jan 1978 ano
11.074
-5.342
-32.54%
1 jan 1979 ano
11.595
+0.52
4.7%
1 jan 1980 ano
11.934
+0.339
2.93%
1 jan 1981 ano
16.127
+4.193
35.14%
1 jan 1982 ano
20.315
+4.188
25.97%
1 jan 1983 ano
25.922
+5.607
27.6%
1 jan 1984 ano
20.106
-5.816
-22.44%
1 jan 1985 ano
19.046
-1.06
-5.27%
1 jan 1986 ano
18.728
-0.318
-1.67%
1 jan 1987 ano
20.118
+1.39
7.42%
1 jan 1988 ano
25.871
+5.753
28.6%
1 jan 1989 ano
24.189
-1.682
-6.5%
1 jan 1990 ano
24.736
+0.546
2.26%
1 jan 1991 ano
23.201
-1.534
-6.2%
1 jan 1992 ano
49.412
+26.211
112.97%
1 jan 1993 ano
31.43
-17.982
-36.39%
1 jan 1994 ano
22.644
-8.786
-27.95%
1 jan 1995 ano
26.826
+4.182
18.47%
1 jan 1996 ano
2.866
-23.96
-89.32%
1 jan 1997 ano
29.374
+26.508
924.94%
1 jan 1998 ano
29.702
+0.329
1.12%
1 jan 1999 ano
29.8
+0.098
0.33%
1 jan 2000 ano
32.031
+2.231
7.49%
1 jan 2001 ano
20.262
-11.769
-36.74%
1 jan 2002 ano
18.26
-2.002
-9.88%
1 jan 2003 ano
18.993
+0.733
4.01%
1 jan 2004 ano
16.314
-2.679
-14.11%
1 jan 2005 ano
18.628
+2.314
14.18%
1 jan 2006 ano
20.538
+1.911
10.26%
1 jan 2007 ano
27.124
+6.586
32.07%
1 jan 2008 ano
31.108
+3.984
14.69%
1 jan 2009 ano
31.929
+0.821
2.64%
1 jan 2010 ano
35.633
+3.704
11.6%
1 jan 2011 ano
38.703
+3.07
8.62%
1 jan 2012 ano
39.885
+1.182
3.05%
1 jan 2013 ano
39.552
-0.333
-0.84%
1 jan 2014 ano
39.042
-0.51
-1.29%
1 jan 2015 ano
41.526
+2.484
6.36%
Classificação de países por estatísticas atuais por anos


Comentários: